Monthly Roundup: March Lives Up to Its Reputation. Now for April...
Here's our initial game plan for April as multiple hurdles remain ahead.
You've reached your free article limit
You've read 0 of 1 free Pro articles.
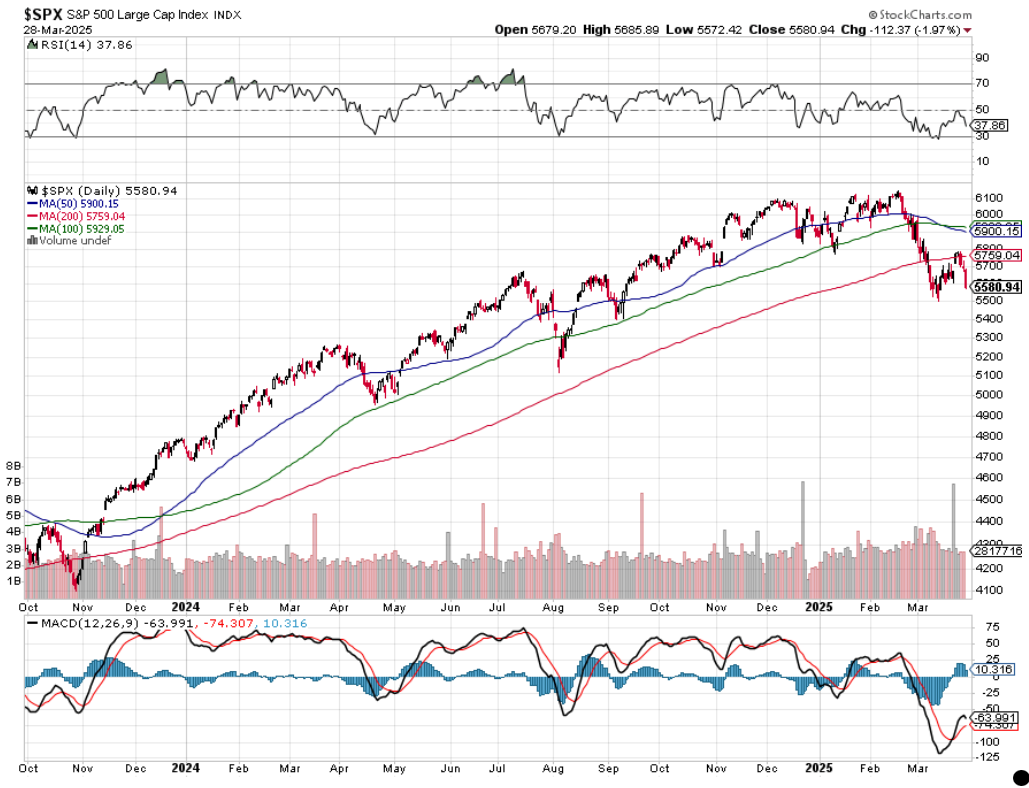
In the TheStreet Pro Portfolio’s February Monthly Roundup, we acknowledged that March tends to be a seasonally weak month for the stock market, and with potential tit-for-tat tariffs, we warned we would want to be extra careful to avoid being head faked in the short-term. Looking back over how the market developed in March, with the S&P 500 continuing to decline, hitting oversold status almost halfway through the month and then rebounding only to reject the 200-day moving average near 5759, we would say that was some good advice. When the S&P 500 started to rebound in mid-March, we shared that to move higher on a sustained basis it would need to eventually re-test its March lows to put in a firm bottom.
Multiple factors have come together in the last two weeks to serve as catalysts for what is shaping up to be that re-test. These include renewed worries not only about the impact of announced Trump tariffs and pending reciprocal ones we’ll learn more about next week, but also the potential cumulative responses from Canada, China, and the European Union.
Reports indicate China has extended an olive branch to the EU to push back on U.S. trade tariffs. Meanwhile, the EU is already working on tariffs for U.S. goods that are expected to be announced on April 12, but it is also reportedly contemplating efforts to hit back on U.S. services exports. Canada’s Prime Minister Mark Carney shared that Canada’s long-standing relationship with the U.S. was “over” and vowed that there would be a “broad renegotiation” of the trade agreement between the countries.
While there is a chance this is all part and parcel of the negotiation dance before President Trump unveils his reciprocal tariffs next week, there is also the possibility for the brewing trade war to escalate further. Trump essentially called that out Thursday after announcing his auto tariffs when he said he would impose additional tariffs on the EU and Canada if they collaborate to "do economic harm" against their "best friend" the United States.
The thing is, we are already seeing the impact of tariff-related uncertainty in corporate guidance and consumer spending as well as inflation data. The Uncertainty Index found in the NFIB Small Business Optimism Index is back near record levels, new orders weakened in March, while job creation slowed per S&P Global’s Flash March PMI. Multiple companies have reported slowing consumer demand, and some have started to discuss the impact of recent tariff announcements on their businesses.
The latest indication of that came this week from Lululemon when the management team said it sees 20 basis points of gross margin headwinds tied to current tariffs on China and Mexico imports. Lululemon also shared it is being impacted by consumers spending less due to increased concerns about inflation and the economy.
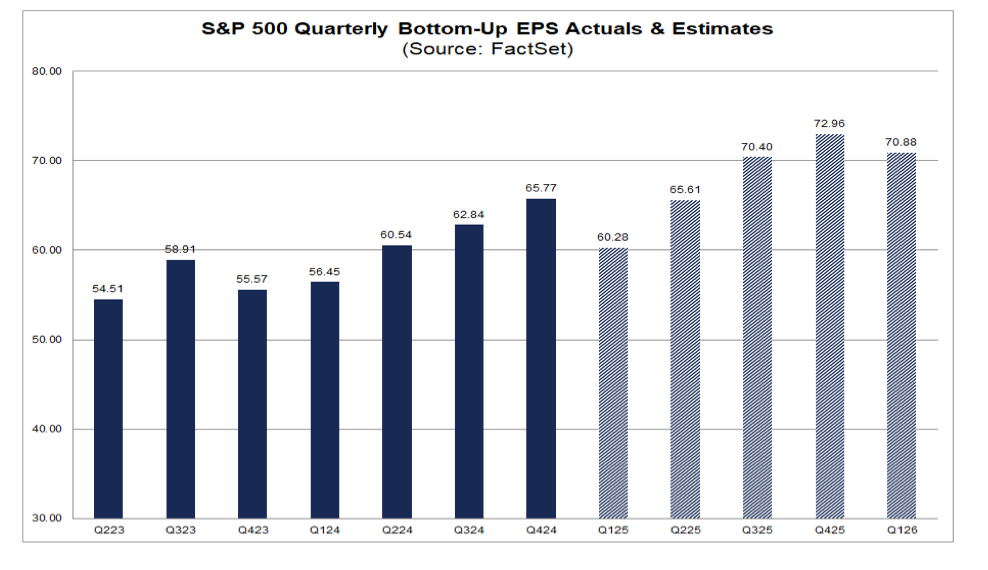
Yet despite those developments and others, consensus Q2 2025 quarter EPS expectations for the S&P 500 still imply nearly 9% growth compared to Q1 2025. Looking back at that level of growth over the past decade and excluding 2020 due to the pandemic, we find the average rate of EPS growth to be 6.1%. That alone suggests the consensus forecast for this year is aggressive, but when we layer in the issues discussed above, odds are reported EPS will disappoint market expectations.
The likely scenario as it stands today is companies will issue more conservative guidance for Q2 2025 than the market expects. Should that play out, it would likely raise questions for the arguably even more aggressive ramp in EPS growth projected for H2 2025 (+13.9% compared to H1 2025 vs. the 9.9% achieved in H2 2024 compared to 1H 2024). Granted, some of that forecasted H2 2025 EPS acceleration may be tied to Trump tax cut hopium, but reality is pointing to progress on that front being a late Q2 2025 event. Considering the potential timing, it doesn’t seem like many companies will be able to bake that expectation into their June-quarter guidance.
That suggests the start of the March-quarter earnings season could be a challenging time for the market. That is why March-quarter earnings pre-announcements will be on our radar next week and the following one ahead of big bank earnings kicking off on Friday, April 11. The next two weeks could also bring another round of sobering inflation data to a market that is only now starting to come to terms with the likelihood the Fed will not deliver the two rate cuts telegraphed in its recently updated set of economic projections.
The title of our March 14 Weekly Roundup was Enjoy the Rebound But Recognize Challenges Remain. It’s our view that many of those challenges we identified back then remain ahead, and as we discuss below in "Catching Up on the Portfolio, that is why we purposely boosted the portfolio’s cash levels this week. With the set of known knowns ahead we will tread carefully with our eyes paying close attention to the market’s technical setup, what March economic data say about the vector and velocity of the economy, tariff developments, and any negative earnings pre-announcements we might get. Should the market’s technical picture deteriorate further, or signs emerge a recession is poised to unfold, we would be inclined to further increase our cash levels.
When it comes to putting cash to work, we will do so in a prudent manner focusing on companies benefiting from continued spending that are poised to deliver superior EPS growth and offer a more than favorable risk-to-reward tradeoff. In short, we’ll look to make moves with the portfolio like we did in H2 2024 that paved the way for the portfolio’s outperformance last year.
Catching Up on the Portfolio
Recapping the portfolio’s moves during March, we raised our cash levels early in the month by trimming back its exposure to Lockheed Martin LMT and Waste Management WM. As the market approached and then entered oversold levels, we put some capital to work, picking up more shares of American Express AXP, Axon Enterprise AXON, Eaton ETN, United Rentals URI, Dutch Bros BROS, Marvell MRVL, ServiceNow NOW, and the Van Eck Uranium & Nuclear ETF NLR.
We also used the retrenchment in shares of Palantir PLTR to initiate a position for the portfolio and added further to it ahead of the company’s AIPCon 6 event mid-month. Following that event, we revised our PLTR price target to $95 from $87, and we are once again revisiting that target following favorable data points about AI adoption and IT spending. We added TJX Companies TJX to the Bullpen in mid-March, and we’ll continue to freshen it up as we identify potential candidates for the portfolio.
During March we made several moves unwinding the portfolio’s position in Mastercard MA. The impetus behind our downgrade to a Four rating and then the staged selling that took advantage of the rebound in the shares was the growing number of warning signs about consumer spending, especially for low-to-middle-income earners. The February Retail Sales report continued some warnings, and consumer confidence continued to fall in March amid concerns about the economy. At the same time, Synchrony Financial (SYF) shared that, "Purchase volumes have gone down across the industry as consumers across all income groups become more thoughtful about spending…" On March 26, following a rebound in MA shares off their March lows and findings from Intuit (INTU), Moody’s, and Morning Consult that brought more concern for consumer spending prospects, we opted to lock in a 52% gain on the portfolio’s MA position.
Following the last of those MA trades and Friday’s exit from Lockheed Martin, we closed the week with ~12.5% of the portfolio’s assets in cash. Factoring in the inverse ETFs for the S&P 500 and Nasdaq Composite the tally for defensive positioning is near 15% as we get ready for the final day of March trading.
As we discuss in "The Week Ahead" below, next week brings many factors that could influence the March-quarter earnings season and June-quarter guidance. As those pieces come into place or don’t, we’ll contemplate putting the portfolio’s cash to work. However, we are not in a rush to put capital to work just to say we are doing something, given the concerns we’ve expressed about June-quarter guidance prospects. We would rather have a higher degree of conviction when the time is right.
Now let’s review what Wall Street had to say about the portfolio’s positions during this last full week of trading for Q1 2025:
Late this week, Jefferies upgraded Applied Materials AMAT to Buy from Hold with a price target of $195, up from $185.
Citi reduced its Bank of America BAC price target to $50 from $54 but reiterated its Buy rating.
Ahead of its 2025 Investor Day, Wells Fargo slapped an Overweight target on the shares of Dutch Bros BROS with an $80 target. You can read our take on what was announced at the event here. Morgan Stanley initiated coverage on BROS shares this week with an Overweight rating as well but with an $82 target.
Scotiabank lowered its price target on Elastic ESTC to $137 from $140 and kept an Outperform rating on the shares. The firm also shared findings that 90% of surveyed IT leaders have not changed or slowed their IT spending plans. That supports not only the portfolio’s position in ESTC shares but also NOW and PLTR.
RBC downgraded Lockheed Martin to Sector Perform from Outperform and revised its target to $480. Melius Research downgraded LMT to Hold from Buy with a price target of $483, down from $603.
Jefferies reiterated its Buy rating and $550 price target for Microsoft MSFT shares calling the recent selloff in shares of Microsoft represents an attractive entry point due to a now "derisked valuation."
JPMorgan lifted its price target on Morgan Stanley MS shares to $129 from $124.
Citi trimmed its Vulcan Materials VMC price target to $285 from $301 citing weaker demand in Q1 2025 due to weather. Winter weather is what makes Q1 a seasonally weak quarter for Vulcan, and we would argue the worst of that is already reflected in the share price.
This Week's Portfolio Videos
We cover a lot of ground during the week in our Daily Rundowns. If you happened to miss one or more of them, here are some helpful links:
Monday, March 24: What We're Expecting From Trump Tariff 'Liberation Day'
Tuesday, March 25: Trump’s April Tariffs — Will He or Won’t He?
Wednesday, March 26: What We're Looking for as This Holding Hosts 2025 Investor Day
Thursday, March 27: Here's a Bullish Data Point for IT Spending and 3 Portfolio Holdings
Friday, March 28: Why the Market Is Likely Setting Up for a Retest of March Lows
Key Global Economic Readings
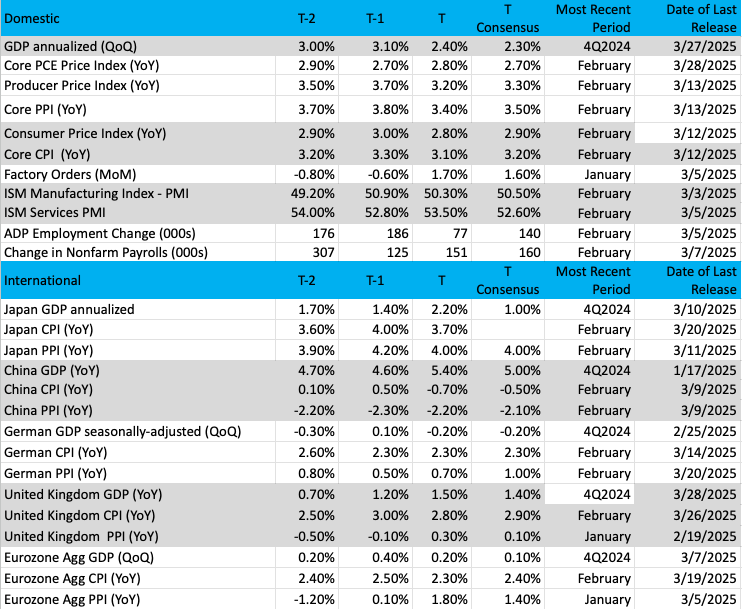
(Note: T is the most recent period, T-1 is the prior period's reading and T-2 is two periods back, the intent being to illustrate any trends)
Chart of the Week: S&P 500 – Market Cap vs. Equal Weighted
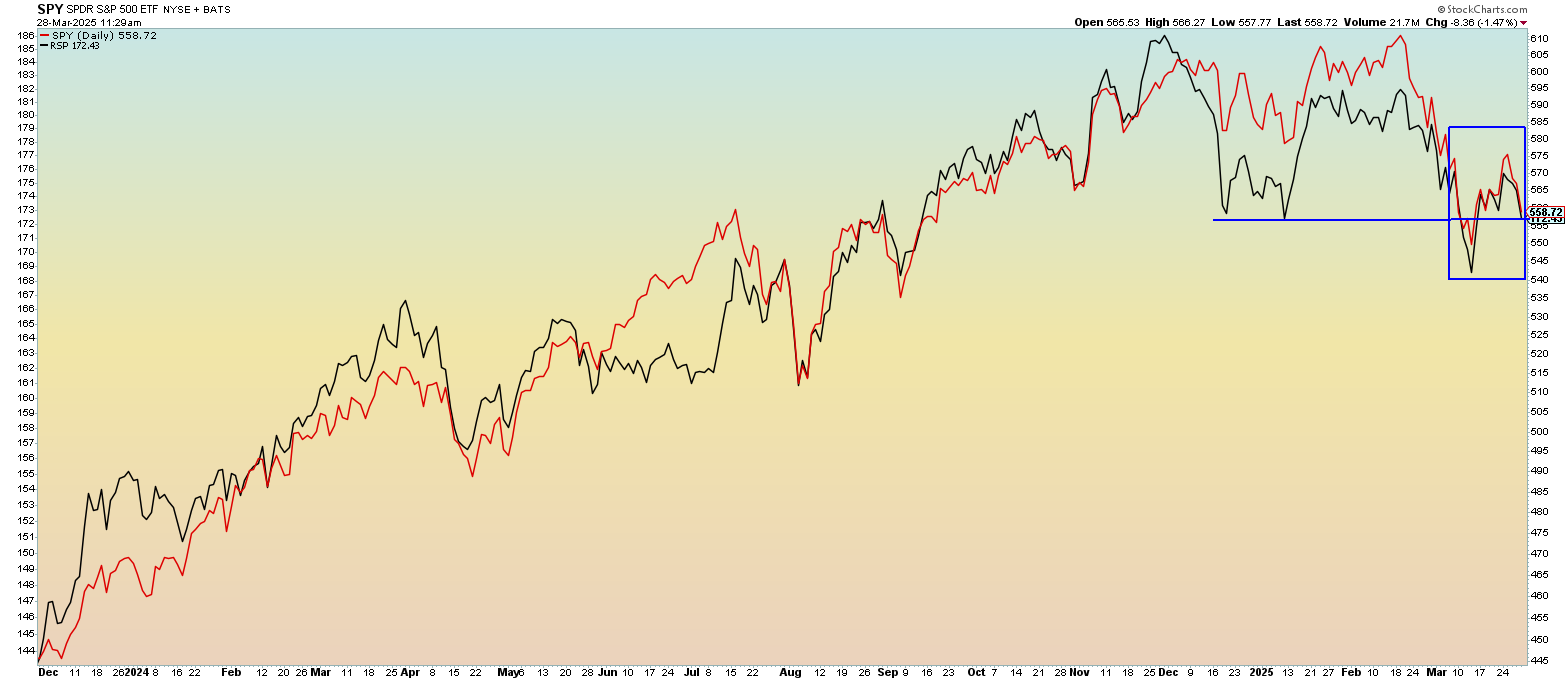
As we approach the end of March, it is time to revisit the SPY vs. RSP chart. Recall the RSP is the equal-weighted S&P 500 ETF, which gives each member an equal vote towards valuing the index, while the SPY is a cap-weighted ETF that gives more weighting to the largest market capitalization names. Think Mag 7 and other heavily weighted Nasdaq names.
We look at this comparison from time to time to isolate the action and determine whether the biggest names are having an "uneven" influence on the markets or if participation is widespread. We have seen the biggest names influence the SPY, certainly over the last few years, but now that relationship looks to be tarnished.
The RSP is starting to gain some traction and while it is down for 2025, it is performing much better than the SPY. The RSP is down 1.5% for 2025 while the SPY is down 4.9% quarter to date. This tells us broad participation abounds in the RSP while the SPY continues to correct and unwind the massive influence of the biggest cap names. That could take months or years to correct, but we are not going to worry about that for now. Stocks in the Mag 7 are not going to be sold indiscriminately for balancing purposes.
The charts of the RSP and SPY are congruent and bearish here, which means the markets are falling and taking all stocks with it. That happens during bearish market moves, and while it is painful to experience that without protection, we know squeezing out excesses is a healthy process.
We have the box around the recent action which shows the similarities between these two ETFs. Further, we have drawn a support line for both the SPY and RSP, which is coming into view. If that support fails, there are much lower targets to hit.
Other charts we shared with you this week were:
Monday, March 24: S&P 500 - A Respite for the Downtrend, But...
Monday, March 24: Meta Platforms (META) - Meta Looks Ready For Prime Time
Tuesday, March 25: Bank of America (BAC) - A Holding Bulks Up Before Earnings Season Begins
Wednesday, March 26: Axon Enterprise (AXON) - Axon Could Surge Higher
Thursday, March 27: Elastic NV (ESTC) - From Rangebound to Big Move?
The Week Ahead
By all accounts next week will be a critical one for stock market investors. In addition to the start of March data that will refresh expectations for the economy, inflation, jobs market, and monetary policy, President Trump’s April 2 “Liberation Day” should bring incremental clarity on the topic of tariffs.
That’s the day when the Trump administration is expected to reveal its plan for reciprocal tariffs. Trump has gone back and forth on his messaging about those tariffs, but recently indicated they will be on all countries, but “very lenient.” Exactly what that means is expected to be laid out next week. Following this week’s announcement of 25% tariffs on “all cars that are not made in the United States” and “absolutely no tariff” for cars that are built in the U.S., it’s the cumulative response from tariff-slapped countries we are bracing for. And their implications.
This is where things will get tricky because Trump has already suggested further tariffs would be imposed on the EU and Canada if they work together “to do economic harm” to the U.S. That sure sounds like the potential for tariff escalation to us, and that would only bring more uncertainty about the economy, inflation, and Fed policy — and also for corporate earnings prospects.
In terms of the key economic data next week, it’s the usual start of the month reports, which includes March Manufacturing and Service PMI data, multiple looks at March job creation and wage gains, and the latest Challenger Job Cuts report. As we digest that cumulative data set and what it says about the economy, we’ll be looking to figure out which regional Fed GDP model depicts a more accurate view of the economy.
The Atlanta Fed’s GDPNow model currently sits at -2.8% for the March quarter compared to the New York Fed’s Nowcast at 2.86%. As we zero in on which one offers a more accurate view of the economy, we’ll also be contemplating the impact on the upcoming March-quarter earnings season and June-quarter guidance. The same goes for consumer spending prospects, which are already showing more than a few cracks.
Here's a closer look at the economic data coming at us next week:
U.S.
Monday, March 31
· Chicago PMI - March
Tuesday, April 1
· S&P Global Final Manufacturing PMI – March (9:45 AM ET)
· ISM Manufacturing PMI – March (10:00 AM ET)
· Jolts Job Openings & Quits – February (10:00 AM ET)
· Construction Spending – February (10:00 AM ET)
Wednesday, April 2
· MBA Mortgage Applications Index – Weekly (7:00 AM ET)
· ADP Employment Change Report – March (8:15 AM ET)
· EIA Crude Oil Inventories – Weekly (10:30 AM ET)
Thursday, April 3
· Challenger Job Cuts Report – March (7:30 AM ET)
· Initial & Continuing Jobless Claims – Weekly (8:30 AM ET)
· S&P Global Final Services PMI – March (9:45 AM ET)
· ISM Services PMI – March (10:00 AM ET)
· EIA Natural Gas Inventories – Weekly (10:30 AM ET)
Friday, April 4
· Employment Report – March (8:30 AM ET)
International
Monday, March 31
· Japan: Industrial Production, Retail Sales – February
· China: NBS Manufacturing & Non-Manufacturing PMI - March
Tuesday, April 1
· Japan: Jibun Final Manufacturing PMI - March
· China: Caixin Final Manufacturing PMI - March
· Eurozone: HCOB Final Manufacturing PMI - March
· UK: S&P Global Final Manufacturing PMI – March
· Eurozone: Flash Inflation Rate - March
Thursday, April 3
· Japan: Jibun Final Services PMI - March
· China: Caixin Final Services PMI - March
· Eurozone: HCOB Final Services PMI - March
· UK: S&P Global Final Services PMI – March
· Eurozone: Producer Price Index - February
When we close the books Monday on March, we will become even more vigilant when it comes to earnings pre-announcements. The reason is that companies will have rolled up their books for the March quarter, ticking and tying their results relative to the guidance they issued earlier this year. With the known unknown, which is April 2, we would not be surprised if the ensuing days contain earnings pre-announcements.
Our thinking is companies could have a better understanding of how tariffs may impact their June-quarter guidance. Then again, it could be a few days before we learn the trade response from those countries feeling the brunt of Trump’s cumulative tariffs. As we mentioned, there is also the risk of further escalation if the White House smells collusion against the U.S. That argues in favor of the following week having an even greater potential for pre-announcements.
Looking at the companies that are expected to deliver their latest quarterly results next week, none are market-moving in and of themselves. Because April 2 lands in the middle of the week, we’ll be far more interested in comments about the impact of tariffs, pricing, and margin comments from those companies reporting in the second half of the week. Based on what we learn from them, we’ll update our forward view as needed.
Here's a closer look at the earnings reports coming at us next week:
Monday, March 31
· Close: Progress Software (PRGS), PVH (PVH)
Tuesday, April 1
· Close: Cal-Maine Foods (CALM)
Wednesday, April 2
· Close: BlackBerry (BB)
Thursday, April 3
· Open: Acuity Brands (AYI), Conagra (CAG), Lamb Weston (LNN), MSC Industrial (MSCI)
· Close: Guess? (GES)
Friday, April 4
· Open: Greenbrier (GBX)
Portfolio Investor Resource Guide
· Economic Data: Here's a List of Links to the Key Economic Data We Closely Watch
· Investing Terminology: 16 Key Terms Club Members Should Know
· 10-Ks: Want to Know About a Stock? Read the Company's Reports
· 10-Qs: Unlock the Numbers and Key Information Behind Your Stock With the 10-Q
· Income Statement: Our Cheat Sheet to Understanding This Financial Document
· Balance Sheet, Cash Flow Statements, and Dividends: How to Know If a Company Is Off-Kilter? Read Its Balance Sheet
· Valuation Metrics: Everyone Wants a Value. Here's How Investors Can Find
· Thematic Investing 101 Webinar
The Portfolio Ratings System
1 - Buy Now (BN): Stocks that look compelling to buy right now.
2 - Stockpile (SP): Positions we would add to on pullbacks or a successful test of technical support levels.
3 - Holding Pattern (HP): Stocks we are holding as we wait for a fresh catalyst to make our next move.
4 - Sell (S): Positions we intend to exit.
ONES
Alphabet GOOGL; $154.33; 1,035 shares; 3.53%; Sector: Communication Services
UPDATE: Alphabet GOOGL continues to show weakness that has hindered the stock since peaking in early February. When the company reported its quarterly results, it outlined a far larger capital spending plan for this year of $75 billion, well ahead of the nearly $60 billion expected, and the $52.5 billion spent in 2024. The bulk of that more-than-40% increase is targeted for “technical infrastructure,” including servers and data centers as the company continues to invest in AI and cloud. There were several positives found in Alphabet’s results. Probably the biggest was the continued climb in the company’s operating margin, which hit 32%, up from 27% in the year-ago quarter. That jump reflects continued gains at Google Services and Google Cloud in the face of ongoing AI and cloud investments to drive future revenue. Absent the losses from Alphabet’s other bets, the combined operating margin of Google Services and Google Cloud were over 36% in the December quarter, up 400 basis points year over year. As Google brings more cloud capacity onstream we should see a re-acceleration in Google Cloud, which, mixed with ongoing cost reduction efforts, should translate into similar action in the company’s EPS. We continue to see the company well positioned for AI adoption, given its treasure trove of data across its search, advertising, and YouTube businesses, which should benefit it in the coming months with an upswing in digital advertising. As AI matures, we see that resulting in further lift to Google Cloud’s revenue and profit generation. We’ll continue to evaluate our price target and rating as necessary. From a technical perspective, the shares have been in a downtrend between mid-February and mid-March and appear to be basing. That process, which often looks like sideways action, can span 4-6 weeks of boring “no movement.” In March, Alphabet signed a definitive agreement to acquire cloud security platform company Wiz, Inc. for $32 billion. The rationale for the transaction is for Wiz to augment Google Cloud’s security offering to alter the current playing field with Amazon’s AWS, Microsoft’s Azure, and others. Helping with that, Wiz is a platform trusted by more than 50% of Fortune 100 companies that already use its products and services, including Agoda, Avery Dennison, BMW, Cushman & Wakefield, DocuSign, Mars, Plaid, Priceline, Salesforce and Slack. We continue to rate GOOGL shares a One at the current price level, but a move back toward being oversold should the market re-test its March lows, would be a compelling pick-up point.
1-Wk. Price Change: -5.9%; Yield: 0.5%
INVESTMENT THESIS: We believe that while search and digital ad dominance are what will carry shares in the near-to mid-term, longer-term it is the company's artificial intelligence "moat" that will provide for new avenues of growth. AI is what has made the company's search, video, and targeted ad capabilities best-in-class and is the driving force behind the company's success in voice (Google Home) and autonomous driving (Waymo). Furthermore, we believe it is this AI expertise that will also make the company more prevalent in other industries, including healthcare via its subsidiary Verily, as AI and machine learning continue to disrupt operations across industries. Adding to our positive view of the company's future opportunities, we believe that Alphabet's free cash flow generation and solid balance sheet set it apart and are what will allow the company to continue taking chances on far-out ground-breaking and potentially world-changing projects. The company is also preparing to roll out Gemini Subscription with enterprise plans for workspace, according to a report. All good news for Alphabet.
Target Price: Reiterate $210; Rating: One
Panic Point: $167
RISKS: Regulatory risk (data privacy), competition, and macroeconomic slowdown impacting consumers and therefore ad buyer activity.
Amazon AMZN; $192.72; 861 shares; 3.67%; Sector: Consumer Discretionary
UPDATE: After a strong start to 2025, Amazon AMZN shares moved lower in February and again in March. We acknowledged that possibility when the company reported its December-quarter results and moved into its slowest quarter of the year with Amazon Web Services (AWS) capacity constrained. The current quarter also has fewer days compared to the year-ago one, but as we move through it, we should see AWS become less capacity-constrained. What we like under CEO Andy Jassy is the added focus on profits and margins that should allow Amazon to fund these investments while also delivering continued bottom-line growth. Our thinking is that, as consumers embrace digital shopping further and the adoption of AI and cloud continues, Amazon stands to reap the benefits of capex and cost/productivity investments in H2 2024 and 2025. We’ll be looking to see that payoff in further margin expansion at the retail-facing business and a pickup in AWS’s performance in the coming quarters. As investors, it’s that step function higher in profit growth that we want to participate in with AMZN shares. Given the upside to our $260 price target, we continue to rate AMZN shares a One, but we recognize the March-quarter earnings season could result in an even better pick-up point.
1-Wk. Price Change: -1.8%; Yield: 0.0%
INVESTMENT THESIS: We believe the upside will result from Amazon's continued eCommerce dominance, AWS's continued leadership in the public cloud space, and ongoing growth of the company's advertising revenue stream, which feeds off Amazon's eCommerce business. Additionally, we think profitability will continue to improve as AWS and advertising account for a larger portion of total sales as both these segments sport higher margins than the eCommerce operation. While we believe the increasing share of the revenue from these higher margin businesses will be key to driving profitability longer-term, we think margins on eCommerce stand to improve as the company's infrastructure is further built out and economies of scale further kick in. The embedded call option is that management is always looking to enter a new space and generate new revenue streams.
Target Price: Reiterate $260; Rating: One
Panic Point: $190
RISKS: High valuation exposes the stock to volatile swings, eCommerce has exposure to slower consumer spending and competition, management is not afraid to invest heavily, potential headwinds resulting from new eCommerce regulation in India, and management is not scared to invest aggressively for growth, which can at times cause volatile reactions as near-term concerns arise relating to the impact on margins.
American Express AXP; $265.48; 490 shares; 2.87%; Sector: Financial Services
UPDATE: Following American Express’ AXP December-quarter earnings report, we boosted our price target to $345 given prospects for greater margin leverage in the coming quarters as Amex targets slower operating expense growth compared to recent years. At the same time, the company plans to refresh 35-50 card products this year, which tend to drive membership levels as well as average fees per card higher. Management targets mid-high teens card fee growth year over year, which expands that steady base of fee-based profits. Those profits account for a meaningful percentage of Amex’s pre-tax income and distinguish it from other payment processing companies. We used the weakness in the shares to pick up shares on March 5 and again on March 12. Data from Morning Consult and Moody’s show far greater spending resiliency for folks earning more than $250,000 per year with that cohort accounting for most of the spending this year. That’s Amex’s wheelhouse. Two items we will be monitoring closely as they relate to this position are Amex’s 2025 card refresh efforts, which tend to include new benefits that foster membership growth and move up the company’s average fee per card. Second, prospects for tax cuts, which, if passed, would be positive for consumer and other spending. Amex will pay its first $0.82 per share quarterly dividend on May 9 to shareholders of record on April 4.
1-Wk. Price Change: -1.9%; Yield: 1.1%
INVESTMENT THESIS: American Express is a globally integrated, membership-driven payments company, providing customers with access to products, insights, and experiences that enrich lives and build business success. The company has four reportable operating segments: U.S. Consumer Services (USCS), Commercial Services (CS), International Card Services (ICS), and Global Merchant and Network Services (GMNS). American Express targets the premium consumer space by continuing to deliver membership benefits that span our customers’ everyday spending, borrowing, travel, and lifestyle needs, expanding its roster of business partners around the globe, and developing a range of experiences that attract high-spending customers. In 2024, the company’s net card fee revenue accounted for 65% of its pre-tax income, which we see providing a differentiated business model that should continue to grow as Amex wins new card members and drives its average fee per card higher.
Target Price: Reiterate $345; Rating: One
Panic Point: Reiterate $255
RISKS: Slowdown in consumer spending, competition, membership growth, merchant acceptance, lack of new product innovation.
Bank of America Corp. BAC; $41.25; 4,410 shares; 4.03%; Sector: Financial Services
UPDATE: In the Monthly Roundup for February, we shared that continued stock market volatility could weigh on IPO expectations despite the continued growth in transaction filings. That is what unfolded and even though M&A activity perked up, Bank of America BAC slumped further in March. However, as we close out the month, it’s not lost on us the shares have moved below their 200-day moving average and they could re-test their March low near $39.50. While we will keep one eye on investment banking activity, given BofA’s commercial bank and credit-card exposure we will be watching the vector and velocity of the economy with the other. The ideal scenario would be a steadily growing economy and the anticipated rebound in investment banking activity unfolding. For the latter, we will be watching the post-IPO trading performance for CoreWeave (CRWV). The priced transaction was scaled down, but even so it was still one of the larger tech IPOs in some time. For the IPO window to remain open, and more recent filings like those from Klarna and StubHub to tap it, we will want to see CRWV shares trade well over the next few weeks. While all eyes are on Trump tariffs, we will continue to follow developments on the regulatory front that could give way to a rebound in M&A activity. We’ve started to see some pickup in that activity with Alphabet’s announced acquisition of cybersecurity company Wiz, but a more robust pace would be another catalyst for BAC shares. However, if that rebound in investment banking activity looks questionable and economic data increasingly points to a risk of recession, we may need to revisit the portfolio’s position in BAC. As we watch out for those signs, we will also keep our ear to the ground for any developments on Trump tax reform.
1-Wk. Price Change: -2.9%; Yield: 2.4%
INVESTMENT THESIS: Bank of America is one of the world's leading financial institutions, serving individual consumers, small and middle-market businesses, and large corporations with a full range of banking, investing, asset management, and other financial and risk management products and services. The company provides unmatched convenience in the United States, serving approximately 67 million consumer and small business clients with approximately 3,900 retail financial centers, approximately 16,000 ATMs, and award-winning digital banking with approximately 56 million verified digital users. Bank of America is a global leader in wealth management, corporate and investment banking, and trading across a broad range of asset classes, serving corporations, governments, institutions, and individuals around the world. Bank of America offers industry-leading support to approximately 3 million small business households through a suite of innovative, easy-to-use online products and services. The company serves clients through operations across the United States, its territories, and approximately 35 countries. From a reporting perspective, the company's business breaks down as follows: Net Interest Income breakdown: Consumer Banking 57%, Global Banking 23%, Global Wealth & Investment Management 14%, and Global Markets 6%; Income Before Tax breakdown: Consumer Banking 42%, Global Banking 27%, Global Wealth & Investment Management 16%, and Global Markets 15%. Bank of America pays a quarterly dividend of $0.22 per share.
Target Price: $53; Rating: One
Panic Point: $39
RISKS: Financial markets, fiscal, monetary, and regulatory policies, economic conditions, and credit ratings.
Eaton Corp. ETN; $274.17; 630 shares; 3.81%; Sector: Industrials
UPDATE: Despite the mid-to-long-term favorable demand outlook for electric power, Eaton ETN shares moved lower in March, building on their February decline. We used that pullback to scoop up additional shares in early March, ahead of the company’s 2025 Investor Day. During that day of management presentations, Eaton reiterated its March-quarter and 2025 guidance and shared its growth and earnings roadmap through 2030. Backing up its March quarter is the company’s $15 billion backlog, which only includes firm data center commitments that power its key reporting segments, Electrical Americas (47% of sales, 60% of operating profit) and Electrical Global (25% and 18%). Thinking about that backlog, Eaton’s total revenue in 2024 was $10.8 billion, so we would argue its visibility over the coming quarter is rather good. Laying out its roadmap through 2030, Eaton’s outlook calls for relatively steady growth between 6% to 9% organically as AI/data center construction is backed by rolling five-year customer forecasts and the updating of the U.S. electrical grid. Roughly 70% of that grid is over 25 years old, which in and of itself should foster an upgrade cycle. Accelerating that is the expected rate of electricity consumption growth forecasted by the Department of Energy. Between data centers, EVs, energy storage, buildings and other factors driving the growth behind the meter means more power is needed in front of the meter. Putting its arms around that, the DOE sees electricity demand rising 3% this year, growing by 15% to 20% in the next decade. During Jensen Huang’s Nvidia GTC 2025 keynote, he shared that by the end of the decade, and potentially sooner, data center build-out should top $1 trillion. It’s that multiyear tailwind we aim to capture by owning ETN shares in the portfolio. Our last slug of ETN shares was picked up near $284, and we continue to see that level offering a favorable risk-to-reward trade-off. Eaton’s first quarterly dividend payment of $1.04 per share was paid on Friday, March 28, to shareholders of record as of March 10.
1-Wk. Price Change: -7.2%; Yield: 1.4%
INVESTMENT THESIS: Eaton is an intelligent power management company that makes products for data center, utility, industrial, commercial, machine building, residential, aerospace, and mobility markets. That business is positioned to capitalize on the megatrends of electrification, energy transition, and digitalization. We see Eaton helping address the power pain point created by data center, EV charging infrastructure, and other drivers of electricity demand. Research estimates that data center power demand will grow 160% by 2030, accounting for 3%-4% of global power up from 1%-2% today. Data centers will use 8% of U.S. power by 2030, compared with 3% in 2022.
Target Price: Reiterate $400; Rating: One
Panic Point: $275
RISKS: Raw material costs, labor costs, end market volatility, government legislation.
Elastic N.V. ESTC; $91.68; 1,712 shares; 3.44%; Sector: Consumer Cyclical
UPDATE: While shares of Elastic NV ESTC had a bumpy ride in February and March, overall, the shares are modestly lower quarter-to-date. Reviewing the company’s recent earnings report, the drivers behind the quarter’s performance and improved outlook tie back to continued customer and subscription revenue growth mixed with growing operating leverage. Elastic’s results also confirm the growing adoption of AI in enterprises and that combination led us to nudge our price target to $140. In that Alert, we shared our thinking as to why Elastic’s guidance for the current quarter is likely to prove conservative. Each week since then has brought fresh signals for AI adoption in the enterprise and other institutions. The next known catalyst for ESTC shares will be the company’s April-quarter earnings report, which will likely be in May. Between now and then we’ll be looking for program and customer wins, refining our price target as needed. We have some room to add to the portfolio’s ESTC position, and a pullback in the market would only improve the already compelling risk-to-reward trade-off in the shares.
1-Wk. Price Change: -5.7%; Yield: 0.0%
INVESTMENT THESIS: As digital transformation drives mission-critical business functions to the cloud, Elastic N.V. brings the portfolio exposure to search AI adoption across IT and enterprise business lines as companies look to drive productivity. Elastic bills itself as the Search AI company and its Elastic Search AI Platform as a hosted, managed service across major cloud providers, including Amazon Web Services (AWS), Google Cloud, and Microsoft’s Azure in more than 55 public cloud regions globally. Customers can also deploy Elastic’s platform across hybrid clouds, public or private clouds, and multi-cloud environments. What we like even more about this is Elastic’s subscription-based business model, which accounts for just over 93% of its total revenue stream. As we’ve discussed before with other companies, this affords not only good visibility but also predictable cash flow and earnings. Moreover, the gross margins associated with the subscription business are above 80%, which helps explain the rising margin profile and EPS as that business has come to account for a greater percentage of overall revenue. When it comes to potential risks, one sign that would lead us to reconsider owning the shares would be if either Elastic’s customer count or its subscription revenue per customer stalled. Another item we’ll be watching because of Elastic’s geographic mix, with 40% of its revenue outside of the U.S., is the dollar and its corresponding foreign exchange impact.
Target Price: Reiterate $140; Rating: One
Panic Point: $90
RISKS: Enterprise software spending, AI adoption, competitive dynamics, foreign exchange risk.
Marvell Technology MRVL; $62.04; 2,205 shares; 3.01%; Sector: Technology
UPDATE: In 2024, Marvell MRVL shares were one of the strongest performers in the portfolio. Following a strong start to 2025, the shares have retraced back to levels last seen in August of last year, landing them firmly not only in correction territory but knocking on the door of being oversold as we near the end of March. After the early March delivery of Marvell’s January-quarter results that beat consensus expectations and April-quarter guidance that book-ended market forecasts, we upgraded the shares to a One rating near $74. Inside the forward guidance, Marvell's midpoint revenue guidance for its April quarter is up 62% year over year, impressive but short of the whisper revenue number near $2 billion. If you’re thinking about all those recent capacity-constrained comments from Microsoft, Amazon, Meta, Alphabet, and others about the cloud/data center capacity and hearing rumblings of Alan Greenspan’s “irrationally exuberance” in your mind, we are right there with you. As those constraints lift, we should see a re-acceleration in Marvell’s data center business when we compare calendar H2 2025 with H1 2025. Given those near-term constraints, we dialed back our price target to $115 from $130. Management shared that the mix of AI is now over 50% of data center revenue, which means when annualizing that January-quarter figure and factoring in the continued ramp of custom AI solutions with Amazon, Meta, and Alphabet, it’s easy to see why Marvell expects “to very significantly exceed [it's] $2.5 billion target in fiscal 2026.” Add in the continued rebound in carrier infrastructure and enterprise networking as AI adoption drives network congestion, and we continue to see a very nice tailwind behind Marvell’s business for this year into next year, especially as its custom AI solution with Microsoft starts to ship in calendar 2026. In mid-March, we picked up additional shares of Marvell for the portfolio near $68.20, but given the current position size, we have some room for a few more shares. While there is sufficient upside to warrant such action now, a more compelling risk-to-reward tradeoff could be had if MRVL moves back into oversold territory as part of a wider market re-testing of its March lows.
1-Wk. Price Change: -11.9%; Yield: 0.4%
INVESTMENT THESIS: Marvell is a fabless supplier of high-performance standard and semi-custom infrastructure semiconductor solutions. These solutions power the data economy, enabling the data center, carrier infrastructure, enterprise networking, consumer, and automotive/industrial end markets. With roughly 75%-80% of Marvell's revenue stream tied to digital infrastructure, we see it continuing to benefit from rising content consumption and creation. Pointing to that rising demand that necessitates network densification and the build of digital infrastructure, Ericsson sees global monthly average usage per smartphone reach 46 gigabytes (GB) by the end of 2028 vs. 19 GB in 2023 and 15 GB in 2022.
Target Price: Reiterate $115; Rating: One
Panic Point: $85
RISKS: Technology risk, customer risk, competition risk, reliance on manufacturing partners, and supply chain constraints.
Morgan Stanley MS; $115.33; 1,462 shares; 3.73%; Sector: Financial Services
UPDATE: In the Monthly Roundup for February, we shared that continued stock market volatility could weigh on IPO expectations despite the continued growth in transaction filings. That is what unfolded and even though M&A activity perked up, our shares of Morgan Stanley MS slumped further in March. However, as we close out the month, the renewed pullback in the market has the shares approaching their 200-day moving average. That brings a nice layer of support, but the catalyst we are watching now is the post-IPO trading performance for CoreWeave (CRWV). The priced transaction was scaled down, but even so it was still one of the larger tech IPOs in some time. For the IPO window to remain open, and more recent filings like those from Klarna and StubHub to tap it, we will want to see CRWV shares trade well over the next few weeks. While all eyes are on Trump tariffs, we will continue to follow developments on the regulatory front that could give way to a rebound in M&A activity. We’ve started to see some pickup in that activity with Alphabet’s announced acquisition of cybersecurity company Wiz, but a more robust pace would be another catalyst for MS shares.
1-Wk. Price Change: -4.0%; Yield: 3.2%
INVESTMENT THESIS: Morgan Stanley reports in three business segments: Institutional Securities (42% of trailing 12-month revenue, 38% of trailing 12-month Income Before Tax), Wealth Management (48%, 55%) and Investment Management (10%, 6%). While the IPO window has yet to reopen, the potential IPO class for 2025 continues to build with recent additions including Klarna and StubHub. That would be a boon to private equity firms and others that have been nursing IPO candidates during the dark period and a positive for Morgan Stanley's investment banking business. Expected deregulation under the Trump administration is a potential catalyst for Morgan's M&A business. Meanwhile, folks continuing to be behind in retirement savings bodes well for Morgan Stanley's wealth management business in the coming quarters while continued market volatility bodes well for its equity trading business.
Target Price: $145; Rating One
Panic Point: $110
RISKS: Market and interest rate risk, credit risk, country risk, and operational risk, including cybersecurity.
Nvidia Corp. NVDA; $109.67; 1,535 shares; 3.72%; Sector: Technology
UPDATE: Shares of Nvidia NVDA have been on a roller coaster ride in February and March, getting bandied about between concerns of an AI bubble and more recently tighter chip export controls aimed primarily at China. However, all indications are AI adoption is continuing and that should continue to pressure AI and data center capacity at multiple Big Tech firms. We saw that at Palantir’s AIPCon 6 event as well as Nvidia’s own GTC 2025 and across multiple Saturday signals we shared during March. While we could see some of Big Tech fine-tune their investment plans, given known capacity constraints at the others we view that as a redirection in supply from Nvidia and others. During GTC 2025, Jensen Huang said that the top-four cloud service providers — Amazon Web Services, Microsoft’s Azure, Google Cloud Platform, and Oracle (ORCL) Cloud — have bought 3.6 million Blackwell GPUs. Remember, they only started shipping in late 2024, and for comparison they purchased 1.3 million Hopper GPUs last year. While that is a big increase, we have to remember the dramatic upswing in AI/data center capital spending is a known known coming off the December-quarter earnings season. So, from that vantage point, those comments from Jensen were ones of confirmation rather than breaking new ground. While Nvidia’s top-line guidance for the current quarter was above market forecasts, the accelerated ramp for its Blackwell solutions is dinging near-term gross margin prospects. As we explained in our Alert, as production matures, Nvidia’s management expects those margins will return to the mid-70s “later this year,” which means that, in the near term, meeting consumer demand trumps cost improvement efforts. Ramping to meet demand isn’t easy under normal conditions but when there is a sea change underway that drives explosive demand, it’s even more challenging. If it sounds like we’re inclined to give Nvidia a pass, we are, but only because of rising AI adoption levels and capital spending to expand the digital infrastructure to support it. We continue to think rising AI adoption across consumers, enterprises, and other institutions (including local, state, and federal governments), driving productivity and other efficiencies, means we have a multi-year explosion of digital content creation and consumption ahead of us that will pressure data center and network capacity. With that in mind, Huang estimated that by the end of the decade, and potentially sooner, data center build-out should top $1 trillion. That keeps us bullish on the shares of Nvidia and others in the portfolio. Should the market move to re-test its early March lows and NVDA re-test their own March lows near $105, that would be a spot to become more aggressive in the shares.
1-Wk. Price Change: -6.8%; Yield: 0.0%
INVESTMENT THESIS: Nvidia is well positioned to benefit from ramping AI and data center spending. The company pioneered accelerated computing to help solve the most challenging computational problems. Nvidia is now a full-stack computing infrastructure company with data-center-scale offerings that are reshaping the industry. The company's full stack includes the foundational CUDA programming model that runs on all Nvidia GPUs, as well as hundreds of domain-specific software libraries, software development kits, or SDKs, and Application Programming Interfaces, or APIs. This deep and broad software stack accelerates the performance and eases the deployment of Nvidia accelerated computing for computationally intensive workloads such as artificial intelligence, model training and inference, data analytics, scientific computing, and 3D graphics, with vertical-specific optimizations to address industries ranging from healthcare and telecom to automotive and manufacturing. Nvidia reports in two business segments: Compute & Networking and Graphics. The Compute & Networking segment (78% of revenue, 85% of operating income) is comprised of Data Center accelerated computing platforms and end-to-end networking platforms, including Quantum for InfiniBand and Spectrum for Ethernet; NVIDIA DRIVE automated-driving platform and automotive development agreements; Jetson robotics and other embedded platforms; Nvidia AI Enterprise and other software; and DGX Cloud software and services. The Graphics segment (22% of revenue, 15% of operating income) includes GeForce GPUs for gaming and PCs, the GeForce NOW game streaming service and related infrastructure; Quadro/NVIDIA RTX GPUs for enterprise workstation graphics; virtual GPU, or vGPU, software for cloud-based visual and virtual computing; automotive platforms for infotainment systems; and Omniverse Enterprise software for building and operating metaverse and 3D internet applications.
Target Price: $175; Rating One
Panic Point: $101
RISKS: Market and interest rate risk, credit risk, country risk, and operational risk, including cybersecurity.
Qualcomm Inc. QCOM; $152.72; 1,200 shares; 4.05%; Sector: Technology
UPDATE: March was a relatively quiet month for Qualcomm QCOM shares, which rose modestly during the month. While that added to their low-single-digit gain so far this year, compared to the year-to-date drop in the S&P 500 and Nasdaq Composite, our QCOM shares have been a solid outperformer. Because of the inherent seasonality in Qualcomm’s smartphone market, the first half of the year tends not to be as strong as the second half. However, with the company’s AI PC business expected to ramp up as OEMs introduce new models, we will continue to monitor new model introductions and new program wins. For 2025, Canalys sees the rebound in the PC market continuing in part as businesses prepare for the end of Windows 10, and for wider refresh efforts as more AI-PC models hit the market. Canalys sees AI-PCs accounting for 35% of the PC market this year, up from around 20% last year. On its recent earnings call, Dell confirmed there are multiple new AI PC models coming between now and the end of H1 2025. On its earnings call, HP revealed the AI PC market experienced remarkable momentum, achieving a sequential growth rate of 25% in Q4 2024. Korean memory company SK Hynix expects AI PC penetration to reach 30%-40% of all PC shipments this year. SK also sees the smartphone market growing by a low-to mid-single-digit percentage this year, but it also sees AI fostering the replacement cycle with those enabled models accounting for 30% of shipments this year. Upcoming catalysts we’ll be watching include March monthly revenue and March-quarter earnings reports from Taiwan Semi and Foxconn. We will also look to see if and how Qualcomm’s burgeoning automotive chip business (less than 10% of December 2024 quarter revenue) may be impacted by President Trump’s auto tariffs that extend to “key automobile parts” including engines, transmissions, powertrain parts, and electrical components. On the technical front, we see support for QCOM shares near $150.
1-Wk. Price Change: -2.6%; Yield: 2.2%
INVESTMENT THESIS: Qualcomm focuses on foundational technologies for the wireless industry, including 3G (third generation), 4G (fourth generation), and 5G (fifth generation) wireless technologies and processor technologies including high-performance, low-power computing, and on-device artificial intelligence technologies. As a connected processor company, its technology roadmap aims to enable the connected intelligent edge (the next generation of smart devices) across industries and applications beyond handsets, including automotive and the Internet of Things (IoT). Qualcomm has three reportable segments: QCT (Qualcomm CDMA Technologies) semiconductor business, which develops and supplies integrated circuits and system software based on 3G/4G/5G and other technologies for use in mobile devices; automotive systems for connectivity, digital cockpit, and ADAS/AD; and IoT including consumer electronic devices; industrial devices; and edge networking products. QCT accounts for 80%-85% of revenue. QTL (Qualcomm Technology Licensing) licensing business grants licenses or otherwise provides rights to use portions of the company's intellectual property portfolio, which includes certain patent rights essential to and/or useful in the manufacture and sale of certain wireless products. QTL accounts for ~15% of Qualcomm's revenue but contributes a greater portion of the company's operating income. Our focus on QCOM shares is revenue diversification as part of management's intended strategy to lessen its reliance on the smartphone market, by tapping into the AI PC, IoT, and automotive chip markets. We see this unfolding over the next few years, which should lead Wall Street to revisit how it values the shares. It is that opportunity we aim to capture by owning the shares over the longer term.
Target Price: $200; Rating: One
Panic Point: $140
RISKS: Customer risk, technology advancement, competition risk, third-party supplier, and manufacturing partner risk.
ServiceNow NOW; $797.76; 207 shares; 3.64%; Sector: Technology
UPDATE: After being a strong performer for the Portfolio in H2 2024, shares of ServiceNow NOW have been under pressure since peaking in January. That multi-week pullback has unfolded amid concerns for the economy and federal contracts. However, nearly every week we continue to see signs of AI adoption across a widening array of industries. Recent and upcoming signals point to Walmart, Carvana, Booking.com, McDonald’s, and others utilizing AI to enhance productivity and the consumer experience. That keeps us positive on ServiceNow’s prospects, especially given the price lift and margin expansion associated with its AI solutions. During the December-quarter earnings call, the management team rattled off some impressive metrics for customer wins, but we were as impressed with the 18% year-over-year increase in total deferred revenue coming into 2025 and the visibility that brings. Exiting 2024, ServiceNow had $3.3 billion remaining under its current share repurchase authorization. Given February and March share levels compared to the Q4 2024 share repurchases at $927 and $1,107, we would be surprised if ServiceNow was not buying back stock. We would also not be surprised to learn the company opted to recharge that program when it reports the current quarter. In early March, ServiceNow announced it would acquire Moveworks for $2.85 billion, a move that would aim to further improve ServiceNow's artificial intelligence monetization by exposing Moveworks' enterprise-grade search offering to its "significant" installed base. Mid-March, ServiceNow rolled out its Yokohama release of preconfigured AI agents across IT, CRM, HR, and other verticals. Shortly thereafter, ServiceNow announced an expansion of its partnership with Nvidia to optimize AI agent deployment across ServiceNow’s industry verticals to better understand complex workflows and dynamically optimize business processes. Those moves along with rising AI adoption keep us bullish on NOW shares despite the recent pain in the share price. Should we see deferred revenue plateau or decline, that would be a potential warning sign that could impact our One rating.
1-Wk. Price Change: -3.6%; Yield: 0.0%
INVESTMENT THESIS: The addition of ServiceNow adds exposure to the enterprise as it deploys AI-enabled solutions across its enterprise workflow platform. The company’s “Now Platform” is a cloud-based solution with embedded AI and machine learning (ML) capabilities that help unify and digitize workflows, driving productivity. At the heart of it, the company’s platform automates workflows across an entire enterprise by connecting disparate departments, systems, and silos in a seamless way to unlock productivity. ServiceNow counts more than 8,100 global customers, including 85% of the Fortune 500, with 97% of its revenue from subscriptions that have notched a 98% renewal rate.
Target Price: Reiterate $1,250; Rating: One
Panic Point: $850
RISKS: Industry and economic risk, competition and competitive pressures, and acquisition risk.
United Rentals URI; $627.65; 270 shares; 3.76%; Sector: Industrials
UPDATE: Following the February reversal in the shares of United Rentals URI, which was partly due to United’s cancellation of its pending acquisition for H&E Equipment, URI shares moved lower in the first half of March but bounced back to close the month little changed. Despite favorable data points on infrastructure construction projects from Tudor Perini (TPC) and similar comments made at Eaton’s 2025 Investor Day, sticky inflation data and tariffs weighed on Fed rate cut expectations. We continue to see URI’s business benefiting from non-residential construction projects, including the $154 billion in mega projects announced in Q4 2024. Through the end of 2024, the number of mega projects announced reached 569 with a cumulative value of $1.7 trillion. Backlog levels for those projects stand at $1.9 trillion up 33% year over year. As impressive as those figures are, only 15% of those projects have started and expectations are a record number of starts will occur this year. That keeps us bullish on URI’s prospects and the shares. For that reason, we used the mover lower in URI shares in early March to add to the portfolio’s position. The next known catalyst for the shares will be the February Construction Spending report out next week.
1-Wk. Price Change: -0.1%; Yield: 1.0%
INVESTMENT THESIS: United Rentals, the largest equipment rental company in the world, operates throughout the United States and Canada, and has a limited presence in Europe, Australia, and New Zealand. It serves industrial and other non-construction; commercial (or private non-residential) construction; and residential construction. Industrial and other non-construction rentals represented approximately 50% of rental revenue, primarily reflecting rentals to manufacturers, energy companies, chemical companies, paper mills, railroads, shipbuilders, utilities, retailers, and infrastructure entities; commercial construction rentals represented approximately 46% of rental revenue, primarily reflecting rentals related to the construction and remodeling of facilities for office space, lodging, healthcare, entertainment, and other commercial purposes; and residential rentals around 4% of revenue. We see the company benefiting on three fronts — the seasonal uptick in construction spending; the release of funds and projects associated with the five-year Biden Infrastructure bill; and the company's nip-and-tuck acquisition strategy that should further enhance its geographic footprint.
Target Price: Reiterate $900; Rating: One
Panic Point: $580
RISKS: Industry and economic risk, competition and competitive pressures, and acquisition risk.
Universal Display OLED; $145.17; 1,290 shares; 4.14%; Sector: Technology
UPDATE: While shares of Universal Display OLED traded off in March, quarter to date their positive move makes them an outperformer compared to the S&P 500 and Nasdaq Composite. Over the last month, the shares have been choppy but also moving sideways, frustrating, we acknowledge, but our play with OLED is tied to the growing adoption of organic light-emitting diode display technology across connected devices, such as smartphones, tablets, and PCs, as well as automotive, lighting, and other markets. During CES 2025 and the more recent Mobile World Congress, device vendors announced new products utilizing the display technology that will ship later this year, making OLED shares a H2 2025 story. As those products, including new laptops from Dell, ship, we expect investors will recognize the shifting landscape that benefits Universal’s business and our shares. When Universal reported its December quarter, we adjusted our OLED price target to $200 from $250 even though the company’s outlook continues to be, in our view, conservative. We laid out our logic behind that reasoning in our earnings Alert. How conservative Universal's 2025 revenue forecast is will be determined by what we see in the coming months, but it’s hard to see how its revenue growth would decelerate from the 12% posted in 2024. Universal will pay its first-quarter 2025 cash dividend of $0.45 per share on March 31 to shareholders of record as of the close of business on March 17.
1-Wk. Price Change: -2.2%; Yield: 1.1%
INVESTMENT THESIS: Universal Display focuses on the development and commercialization of organic light-emitting diode (OLED) technologies and materials for use in display and solid-state lighting applications. OLED displays are capturing a growing share of the display market, especially in the mobile phone, television, monitor, wearable, tablet, notebook, personal computer, augmented reality (AR), virtual reality (VR), and automotive markets. This adoption reflects advantages over competing display technologies concerning power efficiency, contrast ratio, viewing angle, video response time, form factor, and manufacturing cost. Universal Display's business strategy is to develop new OLED materials and sell existing and new materials to product manufacturers for display applications, such as mobile phones, televisions, monitors, wearables, tablets, portable media devices, notebook computers, personal computers, and automotive applications, and specialty and general lighting products. The company also looks to license its OLED material, device design, and manufacturing technologies to those manufacturers. As such, Universal Display has a significant portfolio of proprietary OLED technologies and materials with more than 5,500 patents issued and pending worldwide.
Target Price: Reiterate $200; Rating: One
Panic Point: $135
RISKS: Patent and Intellectual property protection; maintaining OLED manufacturing and customer relationships; technology risk; market risk.
Vulcan Materials Company VMC; $232.94; 613 shares; 3.14%; Sector: Building Materials
UPDATE: Shares of Vulcan Materials VMC followed a similar February and March pattern to the one we saw with United Rentals. No surprise given both serve the same construction end markets. Despite favorable data points on infrastructure construction projects from Tudor Perini (TPC) and similar comments made at Eaton’s 2025 Investor Day, sticky inflation data and tariffs weighed on Fed rate cut expectations. For the coming year, Vulcan sees a third consecutive year of double-digit year-over-year growth in the Aggregates segment, cash gross profit, and a more substantial increase in the Total Asphalt and Concrete segments, cash gross profit. We see that translating into further margin expansion and EPS growth. At the same time, volumes are also expected to rise due to the matriculation of construction mega projects as well as prospects for public highway, pavement, and street construction to grow 8% in 2025 to $128.4 billion. From a different vantage point, through the end of 2024, the number of mega projects announced reached 569 with a cumulative value of $1.7 trillion. Backlog levels for those projects stand at $1.9 trillion up 33% year over year. As impressive as those figures are, only 15% of those projects have started and expectations are a record number of starts will occur this year. That keeps us bullish on Vulcan’s prospects as does favorable pricing dynamics that should drive incremental margin improvement in the coming quarters. As we move past the March quarter, typically the seasonally weakest for Vulcan, the portfolio has room to pick up additional VMC shares. Given the potential for more market turbulence during the March-quarter earnings season, we’re inclined to wait for the right opportunity to do so. The next known catalyst for the shares will be the February Construction Spending report out next week. On March 24, Vulcan paid its latest dividend of $0.49 per share to shareholders of record on March 10.
1-Wk. Price Change: -0.5%; Yield: 0.8%
INVESTMENT THESIS: Vulcan Materials operates primarily in the U.S. and is the nation's largest supplier of construction aggregates (primarily crushed stone, sand, and gravel), a major producer of asphalt mix and ready-mixed concrete, and a supplier of construction paving services. Its products are the indispensable materials used in building homes, offices, places of worship, schools, hospitals, and factories, as well as vital infrastructure including highways, bridges, roads, ports and harbors, water systems, campuses, dams, airports, and rail networks. Ramping spending associated with the Biden Infrastructure Law should drive demand for Vulcan's products over the coming years. Vulcan has historically complemented its organic growth prospects by acquiring businesses to expand its geographic reach and product scope. Since 2014, the company has acquired more than two dozen companies, including the 2021 acquisition of U.S. Concrete. That combination has allowed the company to deliver steady top and bottom-line growth over the last decade, with only a modest decline when the pandemic hit in 2020.
Target Price: Reiterate $310; Rating: One
Panic Point: $225
RISKS: General economic and business conditions; dependence on the construction industry; timing of federal, state, and local funding for infrastructure; changes in the level of spending for private residential and private nonresidential construction.
TWOS
Apple AAPL ; $217.90; 790 shares; 3.82%; Sector: Technology
UPDATE: Despite a rebound in the back half of March, like many other tech-related names, shares of Apple AAPL lost ground so far in March, keeping them a drag on the portfolio. With the upgrade cycle unfolding and the higher-margin Services business poised to become a larger part of the business mix, our AAPL price target remains $270. As we look to gauge Apple’s March-quarter guidance, we will be closely watching comments and upcoming monthly revenue reports from Taiwan Semiconductor and Foxconn. The recent refresh of Apple’s lower-end iPhone to the iPhone 16E model brings Apple Intelligence to that class of devices. Apple is also expected to bring Apple Intelligence to the European Union in April and is working with Alibaba and Baidu to bring similar features to China. That rollout as well as further Apple Intelligence updates in coming iOS updates are other potential catalysts on our watch list. The portfolio’s position in AAPL is a meaningful one and that means we will need to be selective when it comes to adding additional shares. That’s another reason for us to pay close attention to upcoming smartphone and upgrade-related data. While Apple will report its March-quarter results in the coming weeks, attention is already starting to build for what it will unveil on June 9 as it kicks off WWDC2025. One potential catalyst in between those two events is a dividend increase. In the last several years from late April to early May is when Apple has upped its quarterly dividend. Should the market turn lower and Apple shares successfully re-test their March low near $210 that would be a nice potential pickup spot.
1-Wk. Price Change: -0.2%; Yield: 0.5%
INVESTMENT THESIS: While we acknowledge that near-to-midterm performance remains heavily influenced by iPhone sales, the dynamic is shifting as investors finally place greater emphasis on Services growth. We are bullish on the 5G upgrade cycle and believe longer-term upside will continue to come as Services revenue grows its share of overall sales. Services provide for a recurring revenue stream at higher margins, a factor that serves to reduce earnings volatility while allowing for a higher percentage of sales to fall to the bottom line; as a result, we believe that Services growth and the installed base, are much more important than how many devices the company can sell in each 90-day period. In addition to improved profitability, we also believe the transparent nature of this revenue stream will demand an expanded price-to-earnings multiple as segment sales grow. Furthermore, we believe that Apple's desire to push deeper into the healthcare arena will help make its devices invaluable as more life-changing features are added and the company works to democratize health records. Lastly, also see upside resulting from increased adoption of wearables (think the Apple Watch) and potential new product announcements such as an AR/VR headset or an update on Project Titan, the company's secretive autonomous driving program.
Target Price: Reiterate $270; Rating: Two
Panic Point: Reiterate $200
RISKS: Slowdown in consumer spending, competition, lack of new product innovation, elongated replacement cycles, failure to execute on Services growth initiative.
Applied Materials Inc. AMAT; $145.06; 970 shares; 3.12%; Sector: Semiconductor Manufacturing
UPDATE: Quarter to date, shares of Applied Materials AMAT are down around 9%, with the bulk of that decline coming over the last several weeks. Export controls on China led Applied to deliver modestly weaker-than-expected revenue guidance for the current quarter, and that led us to trim our price target to $205 from $210. However, we continue to see the AI and data center spending ramp and growing AI adoption in other devices driving demand for new semi-cap equipment in the coming quarters and next few years. That should translate into a re-acceleration of growth inside Applied. That view was shared by Lam Research, which held its first analyst day in five years in late February. Lam went on to back industry forecasts calling for the chip industry to hit $1 trillion in size in the next several years, primarily due to AI, data center, IoT, and the growing array of connected devices. For context, that’s compared to $627.6 billion in 2024, and while we don’t necessarily pinpoint $1 trillion by 2030, it’s hard to argue with the direction. We see support for the shares near $145 but they also face resistance between $168-$171. Catalysts that could drive the shares through that resistance are likely to be tied to rising semiconductor capital spending levels. That could come as part of the still-in-motion CHIPs Act or through an announcement like the one Nvidia made in mid-March. The company expects to invest hundreds of billions of dollars over the next four years in U.S. semiconductor manufacturing. As Jensen Huang explained, this is part of Nvidia’s efforts to diversify its supply chain from Asia to the U.S., a move that is likely also being influenced by U.S. trade policies. Earlier this month, Taiwan Semiconductor announced a $100 billion investment in chip manufacturing facilities in Arizona, on top of the $65 billion investment agreed under the Biden administration. That and other investments are expected to more than triple U.S. chip manufacturing capacity over the next several years.
1-Wk. Price Change: -4.6%; Yield: 1.3%
INVESTMENT THESIS: Applied provides manufacturing equipment, services, and software to the semiconductor, display, and related industries. With its diverse technology capabilities, Applied delivers products and services that improve device performance, power, yield, and cost. Applied's customers include manufacturers of semiconductor chips, liquid crystal, and organic light-emitting diode displays, and other electronic devices. Applied operates in three reportable segments: Semiconductor Systems (73% of 2024 revenue, 79% of 2024 operating income), Applied Global Services (23%, 20%), and Display and Adjacent Markets (4%, 1%). Key customers include Samsung (12% of 2024 sales), Taiwan Semiconductor (11%), and Intel (less than 10%).
Target Price: Reiterate $205; Rating: Two
Panic Point: $160
RISKS: Manufacturing and supply chain, competitive factors, government regulation, technology change.
Axon Enterprise AXON; $534.95; 187 shares; 2.21%; Sector: Aerospace & Defense
UPDATE: In late February we called Axon Enterprise AXON up to the portfolio from the bullpen, starting the new position at $496.31. Following the company’s December-quarter results we lifted our price target to $625 from $600. Axon continues to benefit from the adoption of Taser and body cameras across the domestic and international landscapes. What we like more is the company’s ability to drive service business growth on top of this by building on its cloud offering, including artificial intelligence solutions such as Draft One, real-time translation, and other offerings that drive revenue per user higher. We also like the continued step up in annual recurring revenue, which crossed $1 billion exiting the December quarter compared to $732 million entering 2024. That bodes extremely well for the services business becoming a larger part of the revenue mix. When we look at the company’s outlook for 2025, revenue guidance of $2.55 billion to $2.65 billion, up around 25% year over year, is above the $2.56 billion market forecast. But we would argue, its adjusted earnings before interest, taxes, depreciation, and amortization guidance is the item to focus on. Management sees that hitting $640 million to $670 million, which implies margins of 24%-26% compared to 25% achieved in 2024. Here’s the thing, as the services business has grown from just under 33% of Axon’s total revenue in 2022 to just over 41% in 2024, its adjusted EBITDA margins have risen to 25.0% last year from 19.5% in 2022. This suggests that as the services segment continues to become a larger piece of the revenue pie from 42.6% in 2024, management’s adjusted EBITDA margin guidance is likely to prove conservative. Following the market’s continued pullback in the first half of March, we added additional shares to the portfolio on March 5 and again on March 12. Following those trades, our AXON position is up double-digits, making it a significant outperformer compared to the S&P 500.
1-Wk. Price Change: -4.5%; Yield: 0.0%
INVESTMENT THESIS: Axon Enterprise develops, manufactures, and sells conducted energy devices and cloud-based digital evidence management software designed for use by law enforcement, corrections, military forces, private security personnel, and private individuals for personal defense. The company operates in two segments: Taser (recently renamed Connected Devices) and Software & Sensors (recently renamed Software & Services). Taser develops and sells CEDs used for protecting users and virtual reality training. Software & Sensors manufactures fully integrated hardware and cloud-based software solutions such as body cameras, automated license plate reading, and digital evidence management systems. Axon delivers its products worldwide and gets most of its revenue from the United States. President Biden's fiscal year 2023 budget requested a fully paid-for new investment of approximately $35 billion to support law enforcement and crime prevention — in addition to a $2 billion discretionary request for these same programs. According to Mordor Intelligence, the wearable, and body-worn cameras market on its own was valued at $1.62 billion in 2020 and is expected to reach $424.63 billion by 2026.
Target Price: Reiterate $625; Rating: Two
Panic Point: $480
RISKS: Manufacturing and supply chain, competitive factors, government regulation, technology change.
Costco Wholesale COST; $929.66; 187 shares; 3.86%; Sector: Consumer Staples
UPDATE: Despite the sizable setback in Costco COST shares in March, they continued to outperform the S&P 500 by a sizable margin. A recent Bank of America survey found that nearly half of Americans at least somewhat agree with the statement, “I am living paycheck to paycheck.” At the same time, shoppers are increasingly tightening their belts, looking to stretch their disposable spending dollars where they can as they brace for prolonged inflation pressures. The March Consumer Confidence report saw the 12-month consumer inflation expectations figure climb to 6.2%, up from 5.8% in February. That along with the pickup in layoffs found in the February Challenger Job Cuts report and federal government cutbacks, consumers are likely to become even more cautious in their spending. That plays into Costco’s positioning rather nicely and we see that powering further share gains as Costo continues to expand its warehouse footprint and flex its digital commerce platforms. The next catalyst for Costco will be its March sales report and its quarterly earnings report on April 9. As we move through the balance of 2025, Costco should realize the benefits of its 2024 membership fee increase.
1-Wk. Price Change: 2.2%; Yield: 0.5%
INVESTMENT THESIS: We like Costco's long-term prospects, driven by a club-based operating model that focuses on volumes, not margins, and therefore offers its customers a value proposition of everyday low prices. The strength of this model has created an incredibly loyal customer base with low churn and continued share gains in both bricks-and-mortar and e-commerce. This is a global concept, evidenced by the strength of sales both in the U.S. and abroad, which includes an emerging China opportunity. We see the company's membership model as a key differentiator vs. other retailers and its plans to open additional warehouse locations in the coming quarters should drive retail volumes and the higher-margin membership fee income as well. We also appreciate management's approach to capital returns and their willingness to return cash when it is in excess on the balance sheet.
Target Price: Reiterate $1,100. Rating: Two
Panic Point: $850
RISKS: Inability to pass through higher costs, fuel prices, weaker consumer, and membership churn.
Dutch Bros BROS; $62.52; 2,053 shares; 2.82%; Sector: Consumer Cyclical
UPDATE: Despite a setback in the Dutch Bros BROS shares over the last few weeks, quarter to date they were one of the strongest performers in the portfolio climbing more than 20%. While we took some BROS chips off the table in mid-February at $84.50, we bought back some shares roughly a month later at $63.37. On March 27, the company held its Investor Day at which it laid out its long-term growth plan and contained some very supportive data points for the current quarter as well. As we explained in our Alert recapping the event, because the management team did not deliver a formal guidance increase in a challenging market environment BROS shares traded off. This isn’t the first time we’ve seen this in the last few weeks, and we are likely to see more of it in the coming ones. What we did see both near and longer-term keeps our bullish stance on the shares intact. With the market poised to move lower and likely re-test its March lows, we will keep an eye on the 100-day moving average for BROS near $59.41, a place that could lead us to not only upgrade the shares if they find their way there and successfully test it but pick up some as well.
1-Wk. Price Change: -4.4%; Yield: 0.0%
INVESTMENT THESIS: Dutch Bros is an operator and franchisor of drive-thru shops that focus on serving high-quality, hand-crafted beverages with unparalleled speed and superior service. Coffee-based beverages make up ~50% of the menu mix, and ~25% of the menu mix is based upon the company’s proprietary Blue Rebel energy drink, which is highly customizable with flavors and modifiers and can be served blended or over ice. The energy platform helps unlock the afternoon daypart and broadens the company’s appeal. The remaining 25% of the menu mix is a wide variety of teas, lemonades, sodas, and smoothies. The company’s west-to-east expansion is a time-tested strategy that should drive revenue and EPS growth over the next several years.
Target Price: Reiterate $85; Rating: Two
Panic Point: $42
RISKS: Commodity risks, labor costs, interest rate risk, inflation.
First Trust Nasdaq Cybersecurity ETF CIBR; $63.39; 2,188 shares; 3.06%; Sector: Cybersecurity
UPDATE: Each time we note ripped-from-the-headlines confirmation points for the portfolio and its underlying strategy, one constant is the signals for cybersecurity demand. Artificial intelligence will super-charge familiar threats in 2025, putting new wrinkles on old security challenges such as phishing, insider threats, and ransomware. Research firm Gartner expects that cybersecurity spending will increase 15% in 2025, from $183.9 billion to $212 billion. We continue to favor the diversified exposure CIBR brings to the portfolio, which complements the cybersecurity efforts at Elastic, Microsoft, and Alphabet. If we see CIBR shares bump up against and successfully test the 100-day moving average near $65, subject to what is happening in the overall market, that could be a nice place for folks to nibble on some shares. As we move through the March-quarter earnings season and digest results and guidance from key holdings in this ETF, we’ll revisit our price target as needed.
1-Wk. Price Change: -2.4%; Yield: 0.0%
INVESTMENT THESIS: The First Trust Nasdaq Cybersecurity ETF seeks investment results that correspond generally to the price and yield (before the fund's fees and expenses) of an equity index called the Nasdaq CTA Cybersecurity Index. The Nasdaq CTA Cybersecurity Index is designed to track the performance of companies engaged in the cybersecurity segment of the technology and industrial sectors. It includes companies primarily involved in the building, implementation, and management of security protocols applied to private and public networks, computers, and mobile devices to protect the integrity of data and network operations. To be included in the index, a security must be listed on an index-eligible global stock exchange and classified as a cybersecurity company as determined by the Consumer Technology Association. Each security must have a worldwide market capitalization of $250 million, have a minimum three-month average daily dollar trading volume of $1 million, and have a minimum free float of 20%.
Target Price: Reiterate $72; Rating: Two
Panic Point: Reiterate $57
RISKS: Cybersecurity spending, technology, and product development, the timing of product sales cycle, new products, and services in response to rapid technological changes and market developments as well as evolving security threats.
Labcorp Holdings Inc. LH; $230.02; 710 shares; 3.61%; Sector: Healthcare
UPDATE: Like other shares in the portfolio, Labcorp LH pulled back with the market in March but still outperformed the market on a quarter-to-date basis. We attribute that to the nature of the company’s business model which skews heavily toward diagnostics and testing. We continue to see the company benefiting from the aging population as it continues to expand the battery of tests it offers and further expands its Diagnostics reach in hospitals, health systems, and regional labs. In 2024, the company inked 10 such transactions and expected free cash flow should allow for that to continue. Similar to how Costco’s expanding footprint helps drive future organic sales growth, we see the same for Labcorp as its reach expands. In March, Labcorp announced it would acquire oncology-focused lab testing assets from BioReference Health (OPK). The deal is expected to close in H2 2025, and those assets that generate approximately $85 million-$100 million in annual revenue are expected to be accretive in year one. Looking at the chart, the shares are basing and offer enough upside to our price target to make it a nice pick-up point for members who are underweight the shares relative to the portfolio’s position size.
1-Wk. Price Change: -1.8%; Yield: 1.3%
INVESTMENT THESIS: Labcorp is a global leader in innovative and comprehensive laboratory services that provides vital information to help doctors, hospitals, pharmaceutical companies, researchers, and patients make clear and confident decisions. By leveraging its diagnostics and drug development capabilities, the company provides insights and accelerates innovations to improve health and improve lives. The company is organized under two segments, consisting of Diagnostics Laboratories (Dx), which includes routine testing and specialty/esoteric testing, and Biopharma Laboratory Services (BLS), consisting of Early Development Research Laboratories and Central Laboratory Services. Our attraction to LH shares stems from the combination of the aging population driving diagnostic testing growth and the increasing array of diagnostic testing as well. That combination is expected to drive the healthcare testing services market to $12.6 billion by 2029, from $7.4 billion in 2024, according to Markets and Markets. To augment its position in oncology, women's health, autoimmune diseases, and neurology, the company has been expanding through acquisitions and partnerships with health systems and regional local labs.
Target Price: Reiterate $265; Rating: Two
Panic Point: Reiterate $200
RISKS: Macroeconomic factors, changes in healthcare reimbursement models and products, government regulations, product discontinuations or recalls.
Meta Platforms META; $576.74; 212 shares; 2.70%; Sector: Communication Services
UPDATE: After steadily building up the portfolio’s position in Meta META during the last five months of 2024, in mid-February, we took advantage of the quarter-to-date move in META to lock in some hefty gains, selling shares near $722. Since then, META shares moved lower week over week until they bottomed out on March 18. The shares have since rebounded, but uncertainty in the market and about the economy could keep them range bound between $574-$622 near-term. While we continue to see Meta’s suite of products winning advertising dollar share, we could see companies concerned about the economic landscape looking to rein in spending, and typically advertising is one of those areas. However, data from Group M, WPP’s media investment group, sees pure-play digital advertising remaining as the strongest channel and forecasts it will account for almost 73% of total advertising in 2025. That backdrop as well as Meta’s utilizing machine learning and AI to deliver enhanced advertising programs across its Family of Apps bodes well for favorable ad prices as companies look to reach Meta’s expanding base of users. Meta clearly telegraphed an ambitious generative AI roadmap for this year, which could restrain the degree of margin improvement we see in the near term. That includes the management team reiterating it will spend $60 billion to $65 billion in capex this year, making it another year of investment. This could result in another step function step-up in margins once the company emerges from this spending ramp. We’ll revisit our $725 target based on Meta’s monetization efforts and as its spending outlook is updated in the coming quarters. Should META shares retest their March lows near $582, subject to market conditions that could be an area of interest. Meta paid its new $0.52 per share per quarter dividend, a 5% increase, on March 26 to shareholders of record on March 14.
1-Wk. Price Change: -3.3%; Yield: 0.4%
INVESTMENT THESIS: Meta segments its business between Family of App Products, which includes Facebook, Instagram, Messenger, Threads, and WhatsApp, and Reality Labs Products, which includes its metaverse and investments and future product R&D. Family of Apps accounts for ~99% of company revenue and 100% of company operating profit. Substantially all of Meta’s revenue is currently generated from advertising on Facebook and Instagram. Family daily active people (DAP) was 3.27 billion on average for June 2024, an increase of 7% year-over-year. Meta expects to spend $60 billion to $65 billion on capex in 2025, a significant increase year over year, with the majority of this spending focused on AI infrastructure and initiatives. Meta is positioned to benefit from the ongoing shift toward digital advertising and the adoption of AI across its product offerings. We recognize Meta is ramping up capital spending as part of the current AI arms race, but we see that as an investment that should drive productivity in its core advertising business. As the company harvests that investment, we could see a step up in margins much like we saw in 2023.
Target Price: Reiterate $725; Rating: Two
Panic Point: $520
RISKS: Ability to add and retain users and user engagement; marketing spend; new products or changes to existing ones; competitive risk, geopolitical risk.
Microsoft Corp. MSFT; $378.80; 425 shares; 3.56%; Sector: Technology
UPDATE: Paired with the February performance of Microsoft MSFT shares, this week’s move lower alongside the overall market has landed the shares in correction territory. Recognizing the company’s Azure business has been and will likely remain capacity-constrained until at least mid-2025, we’ve been inclined to sit on the sidelines with the shares. Microsoft expects to match December-quarter spending levels in each of the next two quarters as it continues to bring more cloud capacity online and targets even higher spending in H2 2025 and H1 2026 to meet customer demand for AI and cloud. Supporting that outlook, Microsoft said its AI business annual revenue run rate surpassed $13 billion and was above expectations. Commercial bookings increased 67% and 75% in constant currency and its Commercial remaining performance obligation increased to $298 billion, up 34%. Roughly 40% will be recognized in revenue in the next 12 months, up 21% year over year, while the remaining portion recognized beyond the next 12 months increased 45%. One area we are watching, however, is the evolving relationship between Microsoft and OpenAI, which earlier this year joined President Trump’s Stargate AI infrastructure project along with Oracle and Softbank. That project is expected to build 20 large data centers in the U.S. over the coming years, and that could explain rumblings that Microsoft may have backed out of a few data center projects. However, with MSFT shares back at their March lows, down considerably since mid-December and below their August 2024 low, the probability that the worst-case scenario has been priced into the shares is likely. The shares do face multiple resistance points near $405, $416, and $421, which likely means the shares will be capped until incremental Azure capacity translates into revenue gains. Given the risk-reward tradeoff and continued signs of AI adoption, based on market developments in the coming days, we may opt to pick up some MSFT shares.
1-Wk. Price Change: -3.2%; Yield: 0.9%
INVESTMENT THESIS: We believe the cloud to be a secular growth trend and that the upside to the shares will result from Microsoft's hybrid cloud leadership as the company grabs market share in this expanding industry. While companies may look to build out multi-cloud environments, Microsoft's Azure offering will be a prime choice thanks to its decision to provide the same "stack" used in the public cloud, to companies for their on-premises data centers. Additionally, we would note that hybrid environments are currently the preference for most companies because they allow them to maintain critical data in-house while taking advantage of the agility and scalability provided by public clouds. Outside of the cloud opportunity, we maintain a positive view on the company's growing gaming business, which we believe is becoming an increasingly prominent factor in the Microsoft growth story as gaming becomes more mainstream, management works to convert its gaming revenue from one-time license purchase to a recurring subscription model and as technologies like augmented/virtual reality evolve. Finally, as it relates to LinkedIn and other subscription-based services such as O365 and various Dynamics products, we continue to value them highly for their recurring revenue streams, which, we remind members, provide for greater transparency of future earnings.
Target Price: $480; Rating: Two
Panic Point: Reiterate $375
RISKS: Slowdown in IT spending, competition, cannibalization of on-premises business by the cloud.
Palantir Technologies PLTR; $85.85; 822 shares; 1.55%; Sector: Financial Services
UPDATE: Following the selloff in shares of Palantir Technologies PLTR from mid-February peak near $125, we added the name to the Bullpen in early March near $77. Shortly thereafter we graduated them to the portfolio near $79 with an initial price target of $87 sharing that for us, the fundamental reason for owning PLTR is to capture the benefits of the company’s expanding and diversifying customer base as well as AI adoption to drive productivity. Leading up to Palantir’s AIPCon 6 event, we added more shares to the portfolio near $83.50 and after the event, we boosted our price target to $95. AIPCon 6, like the three events it held in 2024, showcased partner case studies and productivity gains leveraging Palantir’s solutions as well as new partner announcements. We suspect the company will have a few more events throughout the year, which should demonstrate the widening of its customer base. We aim to revisit our PLTR price target following confirmation from Scotiabank that IT spending has not faltered despite recent concerns about the economy. That matches with other survey findings pointing to more spending on AI this year and next compared to last year. Should we see the market re-test its March lows, the next layer of support for PLTR shares is the 100-day moving average at $79, and in our view that is not only near our original purchase price but a wonderful risk-reward tradeoff to buy more shares.
1-Wk. Price Change: -5.6%; Yield: 0.0%
INVESTMENT THESIS: Palantir Technologies specializes in big data analytics and builds software platforms that help organizations integrate, analyze, and make sense of vast amounts of data for both commercial and government clients. While much has been made about the company’s exposure to the federal government, its software is used across 90 industries and the larger global government sector accounted for 55% of revenue last year. The balance was from the commercial sector. While those percentages matched the ones for 2023, Palantir’s customer count jumped to 711 exiting 2024 from 497 at the end of 2023, nearly double compared to the end of 2023. For 2024, the average revenue across its top 20 customers was $64.6 million, up from $54.6 million in 2023 and $49.4 million in 2022. Commercial remaining deal value (RDV) stood at $1.79 billion exiting 2024, up 49% sequentially and 99% on a year-over-year basis. That equates to about 47% of the expected 2025 revenue. We will continue to monitor Palantir’s RDV and deferred revenue metrics, but in our view, key items to watch will be the continued diversification of its customer base across industries and increasing revenue per customer. Because we are still in the relatively early innings of AI adoption, we are inclined to be long-term owners of PLTR shares. Exiting 2024, Palantir had just over $935 million remaining under its current share repurchase program.
Target Price: $95; Rating Two
Panic Point: $63
RISKS: Economic and IT budget spending risk, technology risk, competition and competitive pressures, and customer acquisition risk.
VanEck Uranium and Nuclear ETF NLR; $74.14; 615 shares; 1.01%; Sector: Industrials
UPDATE: Over the last month, shares of the Uranium and Nuclear ETF NLR were little changed, but all that means is the shares recovered the ground they lost early in the month. Our rationale for owning the shares remains unchanged — to capture the growing interest in using nuclear power to help solve the data center and larger power demand problem. Today nuclear power provides ~10% of the world’s electricity and about 20% of Europe’s electricity. Per Goldman Sachs, power demand from data centers is on track to grow more than 160% by 2030, compared to 2023 levels. In the U.S. alone, big tech companies have signed new contracts for more than 10 GW of possible new nuclear capacity in the last year. From Texas to France and Germany to Japan, fresh plans for nuclear capacity are being put forth. The Portfolio’s position in NLR is down modestly, but it is also a rather small one. We are inclined to be patient with NLR shares given the emerging energy pain point. We are also open to picking up additional ones should the right opportunity present itself, but we do not envision them becoming a significant position size for the portfolio.
1-Wk. Price Change: -6.4%; Yield: 0.0%
INVESTMENT THESIS: The VanEck Uranium and Nuclear ETF seeks to replicate as closely as possible, before fees and expenses, the price and yield performance of the MVIS Global Uranium & Nuclear Energy Index (MVNLRTR), which is intended to track the overall performance of companies involved in: (i) uranium mining or uranium mining projects; (ii) the construction, engineering, and maintenance of nuclear power facilities and nuclear reactors; (iii) the production of electricity from nuclear sources; or (iv) providing equipment, technology and/or services to the nuclear power industry. We see the companies captured in NLR helping address the energy paint point that will be created in part by the expected data center build-out. Figures from the International Energy Agency see a potential doubling of global data center electricity consumption by 2026, driven primarily by the rise of artificial intelligence (AI) applications, potentially reaching over 1,000 terawatt hours (TWh) from the current 460 TWh in 2022. In response, we are seeing companies ranging from Blackstone to Microsoft and Meta announced plans to invest in nuclear power to help power its growing AI operations.
Target Price: $98; Rating: Two
Panic Point: $70
RISKS: Nuclear energy and energy market risks, currency and foreign exchange, political and economic.
Waste Management WM; $227.92; 620 shares; 3.13%; Sector: Industrials
UPDATE: In early March, we took advantage of the overbought status for Waste Management WM shares to lock in a slice of double-digit year-to-date gains, a move that helped lift the portfolio’s cash position. The shares have since traded off, but even so, their quarter-to-date performance has them up low-double digits, making them a strong March-quarter performer. We continue to see top-line growth and margin expansion over the coming quarters. Those efforts should be fueled by the continued adoption of technology and automation across WM’s core residential business, management’s focus on disciplined pricing, and initial synergies of $100 million this year as it integrates Stericycle. Those acquisition synergies are expected to be more heavily weighted to the second half of 2025 and 2026, and a more meaningful update could come at WM’s June Investor Day. At the June Investor Day, we expect a more concrete roadmap for those cost synergies as well as revenue ones. As we get those details, we’ll revisit our $245 target and Two rating as needed. Between now and then, all things being equal, if WM shares pulled back near $218 that would be a pickup point worth considering.
1-Wk. Price Change: 1.3%; Yield: 1.4%
INVESTMENT THESIS: 2025 will see more nonresidential construction activity because of the Biden Infrastructure Law, but now we can finally factor in activity for the CHIPs Act, which saw its first award this week. Other potential drivers include spending associated with the Inflation Reduction Act, including the much-awaited start of building out a nationwide network of EV charging stations. Alongside that bright outlook for WM's commercial business, automation efforts and pricing power in its sticky residential business should drive margins and EPS generation higher in the coming quarters.
Target Price: $245; Rating: Two
Panic Point: $185
RISKS: Industry and economic risk, competition and competitive pressures, and acquisition risk.
Not Rated
ProShares Short QQQ ETF PSQ; $40.62; 1,430 shares; 1.29%
WEEKLY UPDATE: During the month of March, the Portfolio’s position in the ProShares Short QQQ ETF PSQ moved higher, which means they helped insulate the portfolio from the Nasdaq Composite’s move lower month to date. We will also continue to evaluate market dynamics and the rationale for continuing to own PSQ shares in the portfolio. Should President Trump deliver a combination of less-than-feared tariffs and trade deals that dial back concerns about expected inflation pressures and upcoming June quarter guidance, that may give us sufficient reason to unwind the position.
1-Wk. Price Change: 1.5%; Yield: 0.0%
INVESTMENT THESIS: ProShares Short QQQ ETF seeks daily investment results, before fees and expenses, that correspond to the inverse (-1x) of the daily performance of the Nasdaq 100 Index. The Nasdaq 100 Index includes 100 of the largest domestic and international non-financial companies listed on The Nasdaq Stock Market based on market capitalization.
Target Price: N/A
Panic Point: N/A
RISKS: Because PSQ shares track the inverse of the Nasdaq 100 Index, PSQ shares will move lower when the Nasdaq 100 Index moves higher.
ProShares Short S&P500 ETF SH; $44.82; 1,250 shares; 1.24%
WEEKLY UPDATE: During the month of March, the portfolio’s position in the ProShares Short S&P 500 ETF SH moved higher, which means they helped insulate it from the S&P 500’s move lower month to date. We will continue to evaluate SH’s position in the portfolio. Should President Trump deliver a combination of less-than-feared tariffs and trade deals that dial back concerns about expected inflation pressures and upcoming June-quarter guidance, that may give us sufficient reason to unwind the position.
1-Wk. Price Change: 0.9%; Yield: 0.0%
INVESTMENT THESIS: ProShares Short S&P 500 ETF seeks daily investment results, before fees and expenses, that correspond to the inverse (-1x) of the daily performance of the S&P 500. We are using SH shares to blunt market volatility and hedge the portfolio's performance against its benchmark, the S&P 500. Given the tactical nature of this position, we do not expect to hold SH shares for the same length of time as we do the portfolio's long positions.
Target Price: N/A
Panic Point: N/A
RISKS: Because SH shares track the inverse of the S&P 500, SH shares will move lower when the S&P 500 moves higher.
