June Monthly Roundup: Extending Our Lead Over the S&P 500 as First-Half Ends
While we are pleased with our outperformance, we are not taking our eyes off the ball, as items on the horizon could make waves should the market become increasingly overbought.
You've reached your free article limit
You've read 0 of 1 free Pro articles.
June was a very strong month for the market as the S&P 500 and the Nasdaq Composite built on their gains in May to return to positive territory on a year-to-date basis. The Pro Portfolio’s performance in May and June moved it from lagging the S&P 500 at the end of April to widening its lead over the index as we closed the books on the first half of 2025. Fortunately, by following the data and being mindful of the market setup, the moves we made over the last three months fostered the Pro Portfolio’s outperformance during the quarter and year-to-date.
In our daily and weekly commentaries, we’ve discussed the factors that helped the market rebound off its early April lows and pick up momentum in May and June. The long and the short of it was the extreme uncertainty that plagued the market in April regarding Trump tariffs, consumer spending, and the speed of the economy, subsided as we moved through May and improved further in June.
The culmination of that V-shaped recovery has landed both the S&P 500 and Nasdaq Composite in overbought territory with relative strength index levels over 70. With the McClellan oscillator yet to move into overbought territory, we could see the market continue to move higher. While we keep tabs on that oscillator, we will do the same for the S&P 500 as well as the Pro Portfolio’s holdings. Should we see the RSI levels for our positions go even higher, indicating those stocks are becoming increasingly overbought, we may opt to do some prudent register ringing.
Our thinking is that as the market grinds higher, the greater the probability that this week’s economic data, pending trade deal announcements, or the Trump fiscal policy bill that gets passed could disappoint the market. We’ve seen it before, and this wouldn’t be the first time the market has gotten ahead of itself with its expectations. On June 30, we discussed why we think Canada and China aren’t likely to be among the 10 trade deals set to be announced in the coming days.
Around the corner is June-quarter earnings season, which means we already have our ear to the ground for earnings pre-announcements and what they could mean for the market and the Pro Portfolio. As that earnings season gets underway, we’ll be monitoring adjustments to S&P 500 EPS expectations for H2 2025. Exiting June, those earnings were expected to grow 8.6% compared to H1 2025, down from ~14% at the end of March. Yet, as we alluded to above, the S&P 500 has not only retraced its highs from early this year, but it’s also moved past them, hitting new all-time highs along the way.
We’ve talked before about markets getting out over their skis, and while we may not be there just yet, we could be before too long. That means what we learn in the next few weeks will tell us how much more room this market has to run. Those learnings will dictate our actions in the near term, even as we strive to manage the Pro Portfolio for the long term.
In terms of the Pro Portfolio, we are pleased with its recovery and year-to-date outperformance. However, we also recognize we are only at the halfway point of 2025, and still have a long road ahead of us. That means we will continue to follow the data, be mindful of the market’s technical setup and focus on well-positioned companies poised to deliver superior EPS growth. While the market’s current condition means the number of opportunities are fewer, we will continue to hunt for new Bullpen candidates and revisit existing ones where it makes sense. We shared our latest thinking with you on TJX Companies TJX on Friday, June 27, and we continue to keep a close watch on the shares.
Now, as we turn the calendar to July, it’s time to get ready for the wave of June economic data. We’ll be breaking it down, sharing our takeaways on what it means for the market, monetary policy, and the Pro Portfolio. We’ll also provide our thoughts on where the market could go in H2 2025 if those potential hiccups turn out to be far less than feared.
Our next Weekly Roundup will be published on Friday, July 11.
Catching Up on the Pro Portfolio
June was another positive month for the Pro Portfolio, led by significant gains in a number of our holdings. Notable movers for the month included Marvell MRVL, Nvidia NVDA, Meta META, and Eaton ETN, with gains of more than 25%, 15%, 10% and 10%, respectively. However, it would be misleading to just focus on those positions because more than 60% of the Pro Portfolio's holdings outperformed the S&P 500. That percentage expands to more than 75% for Q2 2025. Those gains allowed the Pro Portfolio to not only move higher compared to the end of May but also expand its year-to-date lead over the S&P 500. As we close out the first half of 2025, the Pro Portfolio was up more than 6.6% compared to 5.5% for the S&P 500.
We started June off by adding to positions in Elastic ESTC and Marvell MRVL on June 3, and a day later, we called shares of SuRo Capital SSSS up from the Bullpen. Later in June, noting SuRo’s net asset value per share had likely improved along with the market, we picked up some additional SSSS shares and also added to our position in Alphabet GOOGL. Those same market gains led us to lock in a hefty slice of gains in Microsoft MSFT on June 20. The continued climb in the market led us to make two very profitable but prudent trades when we culled back the Pro Portfolio’s positions in Nvidia NVDA and Marvell MRVL.
We exited June with just over 13% of assets in cash and the balance spread across 25 stocks. On the one hand, that offers us ample firepower to be opportunistic, but on the other, it offers us some cushion if we need to fend off some of the potential market headwinds that are looming in the distance. Those potential headwinds include this week’s June economic data that could show inflation perking back up due to tariffs, H2 2025 corporate guidance that could skew more conservative than expected, trade deals and their final terms, and ongoing tariffs.
While some or none of them may emerge, our thinking is that the higher the market goes from here following its tremendous rebound since early April, and the more overbought it becomes, the more likely any one of those headwind candidates could upset the market. For us, that means continuing to digest each day’s developments and updating our thinking as necessary while noting the market’s reaction and its technicals.
This Past Week's Portfolio Videos
We cover a lot of ground during the week in our Daily Rundowns. If you happened to miss one or more of them, here are some helpful links:
Monday, June 23: Flash PMI Shows Powell's onto Something
Tuesday, June 24: What to Expect From Jerome Powell as Testimony Begins
Wednesday, June 25: Good Buy or Goodbye: SuRo Capital and PepsiCo
Wednesday, June 25: We Like What We Heard From This Holding's Investor Event
Wednesday, June 25: TheStreet Stocks & Markets Podcast: Geopolitics & Your Money With Peter Tchir
Thursday, June 26: Key Inflation Data May Signal Shift in Price Pressures
This Month’s Podcasts and Signals
Big discussions and insights are had during TheStreet Stocks & Markets Podcast, and in the signals we share for the Pro Portfolio’s strategies. Here are some quick links to those conversations conducted over the last several weeks:
June 4: TheStreet Stocks & Markets Podcast: Common Sense Investing With David Miller
June 7: Chocolate Inflation, a Tear in My Non-Alcoholic Beer, AI Everywhere, and More News for Investing
June 11: TheStreet Stocks & Markets Podcast #9: Market Pulse Check With Bob Lang
June 14: Oregon Gets Old, Chocolate Gets Costly, Wallets Start to Close, and More Investing News
June 21: Amazon to AI: 'You're Hired!', Coffee Prices Drip, Electricity Bills Shock, More Investing News
June 25: TheStreet Stocks & Markets Podcast: Geopolitics & Your Money With Peter Tchir
Key Global Economic Readings
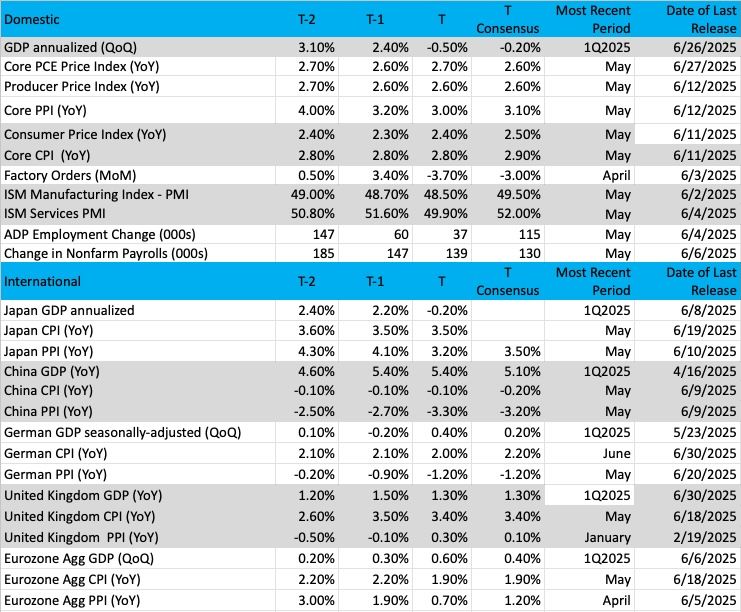
(Note: T is the most recent period, T-1 is the prior period's reading, and T-2 is two periods back, the intent being to illustrate any trends)
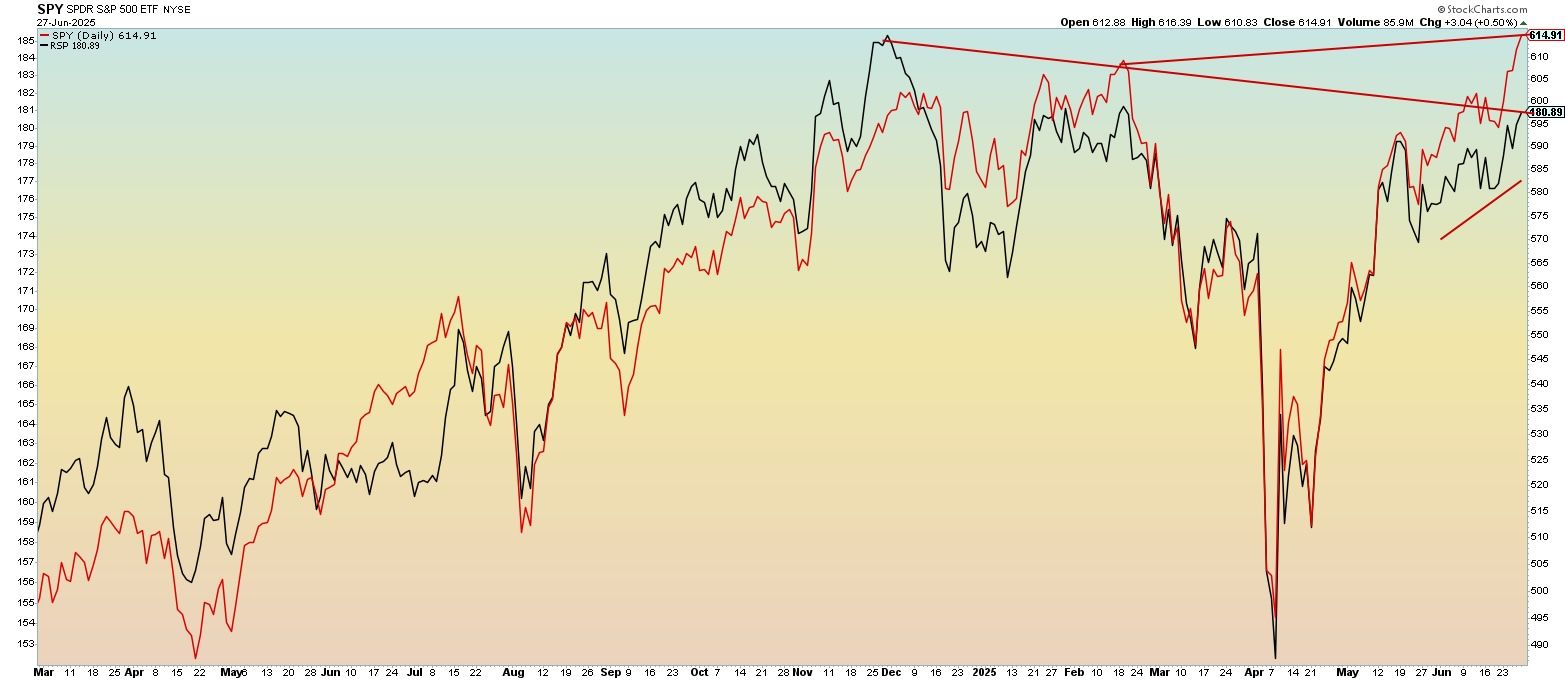
Chart of the Week: S&P 500: Market Cap vs. Equal Weight Flavors
Some very bullish action in the stock market this past month has pushed the S&P 500 SPY ETF (in red) up to a new all-time high. Yet the equal-weighted feature, or the RSP ETF (in black), has not tagged a new all-time high. It is about 2.8% away from those levels reached last November. So, why did one index reach a new high when basically the same index did not? That’s easy to answer, of course, as the SPY is the cap-weighted index and is biased towards the biggest market cap names in the universe. Think Nvidia, Microsoft, Meta, Apple, and those other big Magnificent Seven names that are commented on daily.
But in previous examinations of this SPY vs. RSP comparison, we stated that a "stronger RSP meant a stronger overall stock market to the extent that more groups are participating and that one single group is not carrying the load." Now, if the SPY is outperforming the RSP, as we can clearly see from the chart, does it mean this latest rally is weak? Well, not so fast. The point of the exercise is to compare the movements and not necessarily the overall performance.
For instance, if the SPY is performing well but the RSP is not, then that raises a red flag that far too few stocks are doing well. When the RSP is ahead of the SPY, it means breadth is strong, and the narrowness of the rally is not an issue. But when both the SPY and RSP are performing well, then it means all stocks are participating. As an aside, strong breadth in the market can confirm this to be the case, and recently, new highs have consistently beaten new lows, levels we had not seen for months.
The patterns in the RSP and SPY are very similar in structure. The recent move up has been bold and powerful with good volume and relative strength. Is the market overbought or extended? Probably so, but those are conditions and not signals, meaning we should watch for a downturn of the RSP and SPY first before trying to call an end to this current rally mode.
Other charts we shared with you over the past week were:
Monday, June 23: S&P 500 - Too Much Uncertainty Puts the Market Uptrend at Risk
Monday, June 23: United Rentals (URI) - 'The Longer the Base...'
Tuesday, June 24: First Trust Nasdaq Cybersecurity ETF (CIBR) - A Holding Continues to Impress as 'Bad Actors' Lurk
Wednesday, June 25: American Water Works (AWK) - American Water Works Is Pretty Clean
Thursday, June 26: ServiceNow (NOW) - Why 'Now' May Be the Time for This Holding
Friday, June 27: Marvell (MRVL) - A Marvell Superhero
Monday, June 30: AXON Enterprise (AXON): An Unrelenting Uptrend That's Not Slowing Down
The Week Ahead
With Monday market close, we have put the June 2025 quarter to bed, and now move into the second half of 2025. Because U.S. equities will stop trading at 1 PM ET on Thursday, July 3, and those same markets will be closed on July 4 for the Independence Day holiday, we have just two and a half days of July trading this week. While things will be quiet on the corporate earnings front, the volume of economic data and potential developments in Washington will more than make up for it.
Exiting June, quarter-to-date economic data pointed to the economy continuing to expand, with the Atlanta Fed’s GDPNow rolling forecast pointing to GDP of 2.9% for Q2 2025. While the New York Fed’s NowCast model painted a slower picture, at 1.9%, that was a far better showing than many feared following President Trump’s “Liberation Day” on April 2. The picture on Q2 2025 is far from complete, but as we move through this week and start to receive final June economic figures, that GDP picture will take a more complete shape.
When we pore over this week’s June data, which includes ISM’s Manufacturing and Services PMI data as well as the analogous reports from S&P Global, ADP’s June Employment Report, the Challenger Job Cuts report, and the June Employment Report, we will be mindful of the Fed’s dual mandate as well as implications for upcoming corporate guidance. Should we see the data echo S&P Global’s Flash PMI data for June, it would push back against the notion of a July rate cut, one that the market is already doubting. However, it will likely take a combination of data for June and July as well as August to determine whether the Fed will deliver a rate cut at its September policy meeting. While this may be new for some out there, for us, it’s doing what we do – following the data and letting it talk to us.
In addition to this week’s June data, we will also get the May Construction Spending report, which should be a positive catalyst for the pro Portfolio’s shares of United Rentals URI, Vulcan Materials VMC, Eaton ETN, and, to a lesser extent Waste Management WM.
Here's a closer look at the economic data coming at us the rest of this week:
U.S.
Tuesday, July 1
· S&P Global Manufacturing PMI (Final) – June (9:45 AM ET)
· ISM Manufacturing PMI – June (10:00 AM ET)
· Construction Spending – May (10:00 AM ET)
· Jolts Job Openings & Quits – May (10:00 AM ET)
Wednesday, July 2
· Challenger Job Cuts Report – June (7:30 AM ET)
· MBA Mortgage Applications Index – Weekly (7:00 AM ET)
· ADP Employment Change Report – June (8:15 AM ET)
· EIA Crude Oil Inventories – Weekly (10:30 AM ET)
Thursday, July 3
· Employment Report – June (8:30 AM ET)
· Initial & Continuing Jobless Claims – Weekly (8:30 AM ET)
· S&P Global Services PMI (Final) – June (9:45 AM ET)
· ISM Services PMI – June (10:00 AM ET)
· Factory Orders – May (10:00 AM ET)
· EIA Natural Gas Inventories – Weekly (10:30 AM ET)
Friday, July 4
· US markets closed for the Independence Day holiday
International
Tuesday, July 1
· Japan: Jibun Bank Manufacturing PMI – June
· China: Caixin Manufacturing PMI – June
· Eurozone: HCOB Manufacturing PMI – June
· Eurozone: Inflation Rate - June
· UK: S&P Global Manufacturing PMI - June
Wednesday, July 2
· Eurozone: Unemployment Rate - May
Thursday, July 3
· Japan: Jibun Bank Services PMI – June
· China: Caixin Services PMI – June
· Eurozone: HCOB Services PMI – June
· UK: S&P Global Services PMI - June
Friday, July 4
· Eurozone: Producer Price Index - May
As you can see below, we have less than a handful of corporate earnings reports this week, but we will keep an open mind when we read through the ones from MSC Industrial MSCI and Constellation Brands STZ for comments about end-market demand, inflation pressures, tariffs, and margins. When we return from the Independence Day holiday, companies will have rolled up their Q2 2025 books and be prepping for their upcoming earnings. For us, that means keeping our radar finely tuned for earnings pre-announcements, good or bad, and what that may tell us about the larger market and potentially any of our holdings.
Here's a closer look at the earnings reports coming at us next week:
Tuesday, July 1
· Open: MSC Industrial (MSCI)
· Close: Constellation Brands (STZ),
Wednesday, July 2
· Open: UniFirst (UNF)
Thursday, July 3
· US equity markets close at 1 PM ET
Friday, July 4
· US markets closed for the Independence Day holiday
Portfolio Investor Resource Guide
· Economic Data: Here's a List of Links to the Key Economic Data We Closely Watch
· Investing Terminology: 16 Key Terms Club Members Should Know
· 10-Ks: Want to Know About a Stock? Read the Company's Reports
· 10-Qs: Unlock the Numbers and Key Information Behind Your Stock With the 10-Q
· Income Statement: Our Cheat Sheet to Understanding This Financial Document
· Balance Sheet, Cash Flow Statements, and Dividends: How to Know If a Company Is Off-Kilter? Read Its Balance Sheet
· Valuation Metrics: Everyone Wants a Value. Here's How Investors Can Find
· Thematic Investing 101 Webinar
The Portfolio Ratings System
1 - Buy Now (BN): Stocks that look compelling to buy right now.
2 - Stockpile (SP): Positions we would add to on pullbacks or a successful test of technical support levels.
3 - Holding Pattern (HP): Stocks we are holding as we wait for a fresh catalyst to make our next move.
4 - Sell (S): Positions we intend to exit.
ONES
Alphabet GOOGL; $176.23; 1,108 shares; 3.73%; Sector: Communication Services
UPDATE: Following the net move lower in Q1 2025, shares of Alphabet GOOGL rebounded in April, and that strength continued in May and June. The net move higher off their April lows tallied more than 20% in Q2 2025, which was more than enough to put the shares back in positive territory on a year-to-date basis. We took advantage of the volatility in the shares to add more in June, and we continue to see the company well-positioned, given its search engine and YouTube market share, to capture the ongoing shift to digital advertising. Moving into H2 2025, as incremental capacity for Google Cloud comes on stream, we should see revenue and margins for that Google business improve. We should also see further movement on the company’s AI efforts, building on the groundwork it laid out at its mid-May Google I/O developer event. We recognize the evolving AI landscape and that the growing number of features like those we are seeing in ChatGPT raise questions GOOGL investors haven’t had to face in some time. Our view on Alphabet remains that it would be a mistake to discount its AI position, given the vast quantities of data it can leverage through its search, shopping, advertising, and YouTube businesses. We will continue to follow the efforts by the Department of Justice to split the company, and subject to the outcome, we expect Alphabet will appeal, thereby extending the timetable for any impact several years out.
June Monthly Price Change: 2.6%; Yield: 0.5%
INVESTMENT THESIS: We believe that while search and digital ad dominance are what will carry the shares in the near-to mid-term, longer-term, it is the company's artificial intelligence "moat" that will provide for new avenues of growth. Exiting the March 2025 quarter, Alphabet reported over 270 million paid subscriptions across YouTube and Google One. YouTube Music and Premium alone reached 125 million subscribers globally. AI is what has made the company's search, video, and targeted ad capabilities best-in-class and is the driving force behind the company's success in voice (Google Home) and autonomous driving (Waymo). Furthermore, we believe it is this AI expertise that will also make the company more prevalent in other industries, including healthcare via its subsidiary Verily, as AI and machine learning continue to disrupt operations across industries. Exiting the March 2025 quarter, across all of its products, Alphabet had 0.5 billion users using its Gemini models. Adding to our positive view of the company's future opportunities, we believe that Alphabet's free cash flow generation and solid balance sheet set it apart and are what will allow the company to continue taking chances on far-out, ground-breaking, and potentially world-changing projects as well as fund capital returns to shareholders. We will continue to monitor advertising spend as well as the competitive landscape for the company’s core Search and Advertising business.
Target Price: Reiterate $200; Rating: One
Panic Point: $155
RISKS: Regulatory risk (data privacy), competition, and macroeconomic slowdown impacting consumers and therefore ad buyer activity.
Amazon AMZN; $219.39; 881 shares; 3.69%; Sector: Consumer Discretionary
UPDATE: After falling in the low double digits in the March quarter, Amazon AMZN shares came roaring back with the market in April and May, with that upward strength continuing in June. The cumulative move since their early April bottom led AMZN to finish Q2 2025 higher in the mid-teens, bringing it into positive territory on a year-to-date basis. Moving into the second half, we see many reasons to remain bullish on Amazon, beginning with its upcoming Prime Day 2025 that will span four days, compared to two in the last several years. We see that augmenting Amazon’s wallet share gains as should the Back-to-School shopping season, as consumers continue to be selective with their spending, favoring digital over brick-and-mortar shopping. Data from PYMNTS Intelligence found Amazon continued to win share in discretionary purchases in general, but it also took share from Walmart in food as well as health, beauty, and clothing categories. But that is only part of the Amazon story, and we see continued gains ahead for its higher-margin businesses, including Amazon Web Services and its advertising business. During Amazon’s March-quarter earnings call, CEO Andy Jassy called out the $117 billion annual revenue run rate for AWS, with the backdrop that more than 85% of the global IT spend is still on-premises, not in the cloud as yet, there is ample room to run. In June, Adweek reported advertisers were switching ad budgets from Trade Desk to Amazon, which helped explain the ramp in Amazon’s quarterly advertising revenue in recent quarters. We see that continuing as management focuses on monetizing its various platforms. Two-thirds of the way through May, Amazon CEO Andy Jassy said the company hasn’t seen any meaningful reduction in consumer spending or an increase in prices as a result of tariffs introduced by Trump earlier this year. Any rollback or elimination of Trump tariffs would lead to Wall Street to revisit H2 2025 expectations for Amazon, as could the passage of Trump’s fiscal stimulus bill. Entering July, we have enough upside to our $260 target to maintain our One rating, but should the shares move past $235, barring any fresh developments, we may be inclined to revisit that rating.
June Monthly Price Change: 7.0%; Yield: 0.0%
INVESTMENT THESIS: We believe the upside will result from Amazon's continued eCommerce dominance, AWS's continued leadership in the public cloud space, and the ongoing growth of the company's advertising revenue stream, which feeds off Amazon's eCommerce business. Additionally, we think profitability will continue to improve as AWS and advertising account for a larger portion of total sales, as both these segments sport higher margins than the eCommerce operation. While we believe the increasing share of the revenue from these higher margin businesses will be key to driving profitability longer-term, we think margins on eCommerce stand to improve as the company's infrastructure is further built out and economies of scale further kick in. The embedded call option is that management is always looking to enter a new space and generate new revenue streams.
Target Price: Reiterate $260; Rating: One
Panic Point: $170
RISKS: High valuation exposes the stock to volatile swings, eCommerce has exposure to slower consumer spending and competition, management is not afraid to invest heavily, potential headwinds resulting from new eCommerce regulation in India, and management is not scared to invest aggressively for growth, which can at times cause volatile reactions as near-term concerns arise relating to the impact on margins.
Costco Wholesale COST; $989.94; 187 shares; 3.54%; Sector: Consumer Staples
UPDATE: While shares of Costco COST lagged the market in June, they exited the first half of the year nicely ahead of the S&P 500. The technical picture is challenging near-term, but comparing the company’s monthly comp sales figures against the monthly retail sales report confirms this membership-driven warehouse company continues to win consumer wallet share. Our thesis behind our position in Costco remains unchanged – we continue to see the company winning consumer wallet share while its higher-margin membership fee revenue stream benefits from last year’s price increase and its expanding footprint. As Costco continues to reap the benefits of last year’s membership price hike, it should help minimize the impact of tariffs on Costco’s business even as the company, like others, looks to source more domestic products and from lower-tariff geographies. The company targets 914 worldwide warehouse locations by the end of the current quarter, making it a relatively safe bet that it will continue to deliver year-over-year sales gains and grow that high-margin membership fee revenue stream. In other words, business as usual. The size of the share-price pullback from the early June high has COST shares below their 100-day moving average, and the next level of support clocks in near $960. In our view, this created a very favorable risk-to-reward tradeoff, especially if Trump can deliver trade deals and fiscal stimulus, leading us to upgrade COST shares to a One rating from Two on June 30. As Costco delivers forthcoming monthly revenue reports, we’ll revisit our price target as needed. Costco will report its June sales figures on July 9.
June Monthly Price Change: -4.8%; Yield: 0.5%
INVESTMENT THESIS: We like Costco's long-term prospects, driven by a club-based operating model that focuses on volumes, not margins, and therefore offers its customers a value proposition of everyday low prices. The strength of this model has created an incredibly loyal customer base with low churn and continued share gains in both brick-and-mortar and e-commerce. This is a global concept, evidenced by the strength of sales both in the U.S. and abroad, which includes an emerging China opportunity. We see the company's membership model as a key differentiator vs. other retailers, and its plans to open additional warehouse locations in the coming quarters should drive retail volumes and the higher-margin membership fee income as well. We also appreciate management's approach to capital returns and their willingness to return cash when it is in excess of the balance sheet.
Target Price: Reiterate $1,200; Rating: One
Panic Point: $925
RISKS: Inability to pass through higher costs, fuel prices, weaker consumer, and membership churn.
Eaton Corp. ETN; $356.99; 593 shares; 4.05%; Sector: Industrials
UPDATE: Shares of Eaton ETN were a robust performer for the Pro Portfolio as their cumulative gains in April, May, and June led them to finish Q2 2025 up nearly 30% compared to the S&P 500’s 10% gain. While June was a quiet month for Eaton-specific news, we continued to receive a growing number of signals and other announcements related to AI and data center demand as well as the looming electric power shortfall. Deloitte sees U.S. power sector investments reaching $1.4 trillion between 2025 and 2030. This six-year outlay is equivalent to the total capital expenditure of the U.S. power sector over the preceding 12 years, underscoring the challenge and the opportunity that lies ahead. A new report from ICF projects significant increases in U.S. electricity demand over the next 25 years, with demand rising 25% by 2030 and 78% by 2050. Nearer term, the U.S. Energy Information Administration (EIA) has raised its projections for electricity consumption in the country, citing a spike in power demand from commercial sectors—especially data centers—as a key driver. In its latest update of the Short-Term Energy Outlook (STEO), the EIA said it expects total U.S. electricity demand to rise from 4,097 billion kilowatt-hours (kWh) last year to 4,193bn kWh in 2025, and 4,283bn kWh in 2026. As we see the mix shift move toward AI data centers, we should see Eaton’s dollar per megawatt content rise, given greater power density, larger volumes of electrical equipment, but also greater cooling requirements. In our view, that is the driving story behind the opportunity in Eaton’s shares and one we aim to capture as shareholders. We recognize there will be some modest margin pressure, largely on the company’s Vehicle segment, due to tariffs, but if trade deals emerge and Trump tariffs are rolled back, that would be another catalyst for the shares. For now, we will continue to rate ETN shares a One, but as ETN shares approach $360, we may need to revisit that rating. During the upcoming June-quarter earnings season, we will be mindful of capital spending comments from Big Tech and emerging hyperscalers for H2 2025 and 2026. What we learn could prompt us to revisit our ETN target.
June Monthly Price Change: 11.5%; Yield: 1.2%
INVESTMENT THESIS: Eaton is an intelligent power management company that makes products for data center, utilities, industrial, commercial, machine building, residential, aerospace, and mobility markets. That business is positioned to capitalize on the megatrends of electrification, energy transition, and digitalization. We see Eaton helping address the power pain point created by data center, EV charging infrastructure, and other drivers of electricity demand. Research estimates that data center power demand will grow 160% by 2030, accounting for 3%-4% of global power, up from 1%-2% today. Data centers will use 8% of U.S. power by 2030, compared with 3% in 2022.
Target Price: Reiterate $400; Rating: One
Panic Point: $274
RISKS: Raw material costs, labor costs, end market volatility, and government legislation.
Elastic N.V. ESTC; $84.33; 2,283 shares; 3.68%; Sector: Consumer Cyclical
UPDATE: While Elastic ESTC shares gained ground in June, it wasn’t enough to overcome the move lower earlier in the quarter. That combination resulted in ESTC shares being a drag on the Pro Portfolio’s Q2 2025 performance. Despite the company delivering a consensus-topping April-quarter earnings report, issuing better-than-expected EPS guidance for the coming year, and multiple metrics moving in the right direction, we can trace the slump in the shares to management’s overly conservative top-line forecast for the coming year. We characterize its guidance as such, given the continued expansion in its overall customer base, but notably for its Gen AI customers, and rising contract values that led to record remaining performance obligations and deferred revenue. At the same time, management admitted its guidance was likely overly cautious when it said, “Although we did not see macro impacts beyond the U.S. public sector in Q4, we extrapolated constraints that we saw in the U.S. public sector to potentially extend to our broader business. This is the largest factor affecting our revenue guidance range.” In response, we trimmed our price target to $120 from $140, adopting a more conservative stance. Following the post-earnings selloff, we scooped up additional ESTC shares in early June at $81. Shortly thereafter, Elastic management confirmed its guidance was overly conservative. Based on this confirmation of overly conservative guidance, we reiterate our One rating and suspect that Elastic will continue to deliver beat-and-raise quarters and that recent price target cuts are likely to be reversed. Last week, ESTC shares were upgraded at Monness Crespit & Hardt to Buy from Neutral with a $111 target. We continue to see Elastic benefiting from AI adoption as it should drive favorable pricing and margins. From a technical perspective, there appears to be some support building, indicating ESTC shares may be in the base-building phase.
June Monthly Price Change: 4.3%; Yield: 0.0%
INVESTMENT THESIS: As digital transformation drives mission-critical business functions to the cloud, Elastic N.V. brings the Portfolio exposure to search AI adoption across IT and enterprise business lines as companies look to drive productivity. Elastic bills itself as the Search AI company and its Elastic Search AI Platform as a hosted, managed service across major cloud providers, including Amazon Web Services (AWS), Google Cloud, and Microsoft’s Azure in more than 55 public cloud regions globally. Customers can also deploy Elastic’s platform across hybrid clouds, public or private clouds, and multi-cloud environments. What we like even more about this is Elastic’s subscription-based business model, which accounts for just over 93% of its total revenue stream. This affords not only good visibility but also predictable cash flow and earnings. Moreover, the gross margins associated with the subscription business are above 80%, which helps explain the rising margin profile and EPS, as that business has come to account for a greater percentage of overall revenue. When it comes to potential risks, one sign that would lead us to reconsider owning the shares would be if either Elastic’s customer count or its subscription revenue per customer stalled. Another item we’ll be watching because of Elastic’s geographic mix, with 40% of its revenue outside of the U.S., is the dollar and its corresponding foreign exchange impact.
Target Price: Reiterate $120; Rating: One
Panic Point: $72
RISKS: Enterprise software spending, AI adoption, competitive dynamics, foreign exchange risk.
Marvell Technology MRVL; $77.40; 2,735 shares; 4.05%; Sector: Technology
UPDATE: Shares of Marvell MRVL rebounded sharply in June, rising more than 25%, bringing their cumulative Q2 2025 move to more than that. We continued to add to our MRVL position in early June, building on moves we made in March, April, and May, with that last batch of shares scooped up at $62.29 on June 3. Following the dramatic share-price surge of more than 25% in June, our portfolio discipline led us to take a very profitable slice of MRVL shares off the table, locking in a triple-digit gain. There were multiple catalysts for the June move in MRVL shares, including Taiwan Semi’s May revenue report as well as bullish commentary on AI and data center chip demand from other companies, including Nvidia. Arguably, the biggest catalyst for MRVL shares was the company’s June Custom Silicon investor event. During the event, Marvell shared that it has 18 different sockets in the custom market across Big Tech players and emerging hyperscalers. Moreover, the company is tracking more than 50 additional opportunities in its pipeline, some of which are future versions of existing socket wins. During the presentation, Marvell specified that 12 of the 18 custom sockets are with four of the top U.S. hyperscalers, which can be inferred to mean Microsoft, Amazon, Meta, and Alphabet. The balance is with emerging hyperscalers. This should push back on market-share questions, and in our view, should remind investors that the AI and data center buildout should be viewed as a rising tide that will lift multiple boats, and Marvell is one of them. Speaking further on those 18 wins, Marvell said that some of them are in production today, and others come on stream in 2026 and 2027. That led Marvell to increase its total available market (TAM) to $94 billion by 2028, 25% higher than the $75 billion by 2028 it outlined this time last year. The ramp of those programs could limit margin improvement near-term, but even so, the company should continue to generate larger profit dollars as those volumes ramp, painting a favorable outlook for EPS growth in the coming years. The continued rebound in its Carrier Infrastructure and Enterprise Networking businesses and the maturing of Marvell’s custom AI silicon business, much like the maturing we are seeing with Nvidia’s Blackwell business, should lead margins higher. That combination should drive another dramatic year-over-year jump in Marvell’s EPS compared to the $0.30 posted for the July 2024 quarter. That perspective, those figures, and their implied growth rates keep us bullish on Marvell. Exiting the company’s June event, we reiterated our $115 MRVL target, but as fresh data on AI and data center spending is had, we’ll revisit it as needed.
June Monthly Price Change: 28.6%; Yield: 0.3%
INVESTMENT THESIS: Marvell is a fabless supplier of high-performance standard and semi-custom infrastructure semiconductor solutions. These solutions power the data economy, enabling the data center, carrier infrastructure, enterprise networking, consumer, and automotive/industrial end markets. With roughly 75%-80% of Marvell's revenue stream tied to digital infrastructure, we see it continuing to benefit from rising content consumption and creation. Pointing to that rising demand that necessitates network densification and the build of digital infrastructure, Ericsson sees global monthly average usage per smartphone reach 46 gigabytes (GB) by the end of 2028 vs. 19 GB in 2023 and 15 GB in 2022.
Target Price: Reiterate $115; Rating: One
Panic Point: $60
RISKS: Technology risk, customer risk, competition risk, reliance on manufacturing partners, and supply chain constraints.
Nvidia Corp. NVDA; $157.99; 1,385 shares; 4.19%; Sector: Technology
UPDATE: Shares of Nvidia NVDA started out Q2 2025 a bit slow following their double-digit collapse in March but picked up considerable momentum in May as Big Tech continued to reaffirm 2025 capital spending plans, newly public CoreWeave upped its spending budget, and both Taiwan Semiconductor and Foxconn delivered favorable AI and data center figures. That momentum continued in June, with NVDA shares climbing double digits again, culminating in an impressive move of more than 40% for the quarter, which also landed the shares in overbought territory. The company made several moves in June to expand artificial intelligence technology centers in Europe, partnering with Germany's Deutsche Telekom to create the first industrial AI cloud for European manufacturers. Nvidia also announced deals with companies in the United Kingdom as the U.K. government looks to bulk up the country's AI capabilities. Those announcements follow the partnership announced in May with the Saudi Arabian government to build AI infrastructure. Being the prudent investors that we are, we capitalized on that cumulative move and overbought status, ringing the register on June 26 to lock in a gain of more than 100% on a modest slug of NVDA shares with an exit price of near $154. We continue to see NVDA well-positioned as AI adoption accelerates and the subsequent demand for AI factories keeps us not only bullish on the shares but wanting to remain owners of them. CEO Jensen Huang estimates that by the end of the decade, and potentially sooner, data center build-out should top $1 trillion. On June 30, we lifted our NVDA price target to $185 from $175 as the shares have room to run from a technical perspective. We’ll continue to follow the data and signals, including upcoming monthly revenue reports from Taiwan Semi and Foxconn, as well as AI and data center capex comments in the upcoming Q2 2025 earnings season. Part of that will be the continued adoption of AI across the enterprise as well as in consumer electronic devices. As we digest those revised expectations for H2 2025, we’ll revisit our NVDA price target as warranted. Ahead of those reports, Nvidia sees its July quarter revenue between $44.10 billion and $45.90 billion, up 50% year over year at the midpoint, which reflects continued sequential growth across all of its platforms. In the all-important Data Center business, the ramp of Blackwell is expected to accelerate, and as that continues, we should see margins begin to bounce back. Given our recent trimming and current RSI level, we would not commit fresh capital at current levels, but a pullback near $145 could bring another opportunity for folks that have stayed on the sidelines thus far. As NVDA shares move higher, we may revisit our One rating as they pass $165.
June Monthly Price Change: 16.9%; Yield: 0.03%
INVESTMENT THESIS: Nvidia is well-positioned to benefit from ramping AI and data center spending. The company pioneered accelerated computing to help solve the most challenging computational problems. Nvidia is now a full-stack computing infrastructure company with data-center-scale offerings that are reshaping the industry. The company's full stack includes the foundational CUDA programming model that runs on all Nvidia GPUs, as well as hundreds of domain-specific software libraries, software development kits, or SDKs, and Application Programming Interfaces, or APIs. This deep and broad software stack accelerates the performance and eases the deployment of Nvidia accelerated computing for computationally intensive workloads such as artificial intelligence, model training and inference, data analytics, scientific computing, and 3D graphics, with vertical-specific optimizations to address industries ranging from healthcare and telecom to automotive and manufacturing. Nvidia reports in two business segments: Compute & Networking and Graphics. The Compute & Networking segment (78% of revenue, 85% of operating income) is comprised of Data Center accelerated computing platforms and end-to-end networking platforms, including Quantum for InfiniBand and Spectrum for Ethernet; NVIDIA DRIVE automated-driving platform and automotive development agreements; Jetson robotics and other embedded platforms; Nvidia AI Enterprise and other software; and DGX Cloud software and services. The Graphics segment (22% of revenue, 15% of operating income) includes GeForce GPUs for gaming and PCs, the GeForce NOW game streaming service and related infrastructure; Quadro/NVIDIA RTX GPUs for enterprise workstation graphics; virtual GPU, or vGPU, software for cloud-based visual and virtual computing; automotive platforms for infotainment systems; and Omniverse Enterprise software for building and operating metaverse and 3D internet applications.
Target Price: $185; Rating One
Panic Point: $120
RISKS: Market and interest rate risk, credit risk, country risk, and operational risk, including cybersecurity.
Qualcomm Inc. QCOM; $159.26; 1,220 shares; 3.71%; Sector: Technology
UPDATE: After moving modestly lower in April and May, shares of Qualcomm QCOM rebounded hard in June, making them a positive contributor to the Pro Portfolio during the quarter. Our rationale for owning QCOM shares stems from the company’s diversification efforts away from the smartphone market by leveraging its chip expertise in the AI PC, IoT, and automotive markets. On June 9, Qualcomm expanded its reach into the digital infrastructure market with its $2.4 billion acquisition of Alphawave. Alphawave is a vertically integrated chip firm that focuses on high-speed connectivity and compute silicon for digital infrastructure with low-power solutions. Alphawave counts tier-one customers across the data center (including hyperscalers and AI-centric data centers), compute, networking, AI, 5G, autonomous vehicles, and storage end markets. What we like about the transaction is it should help foster Qualcomm’s diversification efforts away from the smartphone into higher-growth semiconductor end markets. Also, like Qualcomm, Alphawave leans into its IP portfolio, which should mesh very well with Qualcomm’s higher-margin licensing business. In Micron’s recent quarterly earnings report, it shared that it continues to see significant growth in AI servers, PC market units growing in low-single digits, and smartphone volumes up low-single digits. That bodes well for Qualcomm’s existing revenue as well as its diversification efforts, especially given the seasonally stronger volumes for both markets in the second half of the year. As we enter that period, we continue to rate QCOM shares a One. Upcoming catalysts include quarterly results from Taiwan Semi and Foxconn, as well as those from other connected device and IoT-related companies. Based on those learnings, we’ll update our QCOM price target as necessary.
June Monthly Price Change: 9.7%; Yield: 2.2%
INVESTMENT THESIS: Qualcomm focuses on foundational technologies for the wireless industry, including 3G (third generation), 4G (fourth generation), and 5G (fifth generation) wireless technologies and processor technologies, including high-performance, low-power computing, and on-device artificial intelligence technologies. As a connected processor company, its technology roadmap aims to enable the connected intelligent edge (the next generation of smart devices) across industries and applications beyond handsets, including automotive and the Internet of Things (IoT). Qualcomm has three reportable segments: QCT (Qualcomm CDMA Technologies) semiconductor business, which develops and supplies integrated circuits and system software based on 3G/4G/5G and other technologies for use in mobile devices; automotive systems for connectivity, digital cockpit, and ADAS/AD; and IoT including consumer electronic devices, industrial devices, and edge networking products. QCT accounts for 80%-85% of revenue. QTL (Qualcomm Technology Licensing) licensing business grants licenses or otherwise provides rights to use portions of the company's intellectual property portfolio, which includes certain patent rights essential to and/or useful in the manufacture and sale of certain wireless products. QTL accounts for ~15% of Qualcomm's revenue but contributes a greater portion of the company's operating income. Our focus on QCOM shares is revenue diversification as part of management's intended strategy to lessen its reliance on the smartphone market by tapping into the AI PC, IoT, and automotive chip markets. We see this unfolding over the next few years, which should lead Wall Street to revisit how it values the shares. It is that opportunity we aim to capture by owning the shares over the longer term.
Target Price: $180; Rating: One
Panic Point: $135
RISKS: Customer risk, technology advancement, competition risk, third-party supplier, and manufacturing partner risk.
ServiceNow NOW; $1,028.08; 193 shares; 3.78%; Sector: Technology
UPDATE: While ServiceNow’s NOW climb slowed in June, the cumulative move during the quarter, one that is backed by rising enterprise adoption of AI, tallied nearly 30%. For the June quarter, ServiceNow sees subscription revenue coming in at $3.03 billion-$3.04 billion, which implies overall revenue near $3.1 billion compared to $2.6 billion in the year-ago quarter. The lift in that outlook, which could prove conservative, is backed by the company’s current remaining performance obligations (cPRO) of $10.3 billion and remaining performance obligations (RPO) of $22.3 billion exiting the March quarter. Those same figures, which were up 19% and 23%, respectively, on a year-over-year basis, also back the higher subscription revenue outlook of $12.64 billion‑$12.68 billion for this year. In late June, BofA named ServiceNow as one of the top beneficiaries of AI agent spending, which it sees reaching a market size of $155 billion by 2030. A few days later, Evercore ISI voiced its view that ServiceNow is likely to deliver a beat-and-raise June quarter when it reports in the coming weeks. Evercore based that comment on survey findings that show a larger percentage of respondents see a strong ServiceNow pipeline compared to three to six months ago. As AI adoption accelerates, the positive mix shift for ServiceNow’s subscription revenue margins should expand, driving stronger cash flow and earnings. We intend to capture that and the upside it should drive for NOW shares. With support between $967-$977, should a market pullback drag NOW shares to those levels, and hold, it would be a nice place to add additional shares.
June Monthly Price Change: 1.7%; Yield: 0.0%
INVESTMENT THESIS: The addition of ServiceNow adds exposure to the enterprise as it deploys AI-enabled solutions across its enterprise workflow platform. The company’s “Now Platform” is a cloud-based solution with embedded AI and machine learning (ML) capabilities that help unify and digitize workflows, driving productivity. At the heart of it, the company’s platform automates workflows across an entire enterprise by connecting disparate departments, systems, and silos in a seamless way to unlock productivity. ServiceNow counts more than 8,100 global customers, including 85% of the Fortune 500, with 97% of its revenue from subscriptions that have notched a 98% renewal rate. During the March 2025 quarter, ServiceNow also announced plans to acquire Moveworks, which offers front-end AI assistant and enterprise search technology, and Logik.ai, which provides AI-powered, and composable configure, price, and quote solutions for sales teams. We see these moves augmenting its offering and helping pave the way for further adoption of AI and subscription-based revenue.
Target Price: Reiterate $1,100; Rating: One
Panic Point: $800
RISKS: Industry and economic risk, competition and competitive pressures, and acquisition risk.
United Rentals URI; $753.40; 270 shares; 3.88%; Sector: Industrials
UPDATE: Since bottoming in early April, shares of United Rentals URI have been a steady and strong performer for the Pro Portfolio, rising at pace nearly double the S&P 500 in the June quarter. Recent comments from Dycom and others that they are benefiting from the construction of new data centers, as well as infrastructure programs and other drivers of non-residential construction, keep us bullish on URI shares as we move deeper into the company’s seasonally strongest time of the year. Last week, we saw the stock bolt above the 200-day moving average, which was acting as strong resistance for more than a month. In our recent technical look at URI, we discussed the shares building a base and the importance of that exercise, a development that was on strong volume, which is an indication that big money was coming into the stock. Strong volume tells us the sturdiest hands see a bargain, and with United Rentals far off the all-time highs reached late in 2024, there is plenty of room for upside. Recently, Goldman Sachs reiterated its Buy rating and increased its price target to $850 from $770; Citi also upped its target to $810 from $740 and maintained a Buy rating. When we digest the May Construction Spending report, which will be published on July 1, we will look to revisit our URI price target. We’ll do that again during the June-quarter earnings season when companies like Caterpillar, Terex, Tutor Perini, and others update their guidance for H2 2025 and beyond. On the March earnings call, management discussed the re-armed $1.5 billion share repurchase authorization, sharing expectations to fully utilize it by the end of the March 2026 quarter. For this year, including the $250 million repurchased in the March 2025 quarter, management targets repurchasing $1.5 billion in stock. Simple math tells us that means a big step up in activity over the coming quarters to hit that target. As the company delivers on that program, we’ll factor that impact on its bottom line into our thinking as well.
June Monthly Price Change: 6.4%; Yield: 1.0%
INVESTMENT THESIS: United Rentals, the largest equipment rental company in the world, operates throughout the United States and Canada, and has a limited presence in Europe, Australia, and New Zealand. It serves industrial and other non-construction, commercial (or private non-residential) construction, and residential construction. Industrial and other non-construction rentals represented approximately 50% of rental revenue, primarily reflecting rentals to manufacturers, energy companies, chemical companies, paper mills, railroads, shipbuilders, utilities, retailers, and infrastructure entities; commercial construction rentals represented approximately 46% of rental revenue, primarily reflecting rentals related to the construction and remodeling of facilities for office space, lodging, healthcare, entertainment, and other commercial purposes; and residential rentals around 4% of revenue. We see the company benefiting on three fronts — the seasonal uptick in construction spending, the release of funds and projects associated with the five-year Biden Infrastructure bill; and the company's nip-and-tuck acquisition strategy that should further enhance its geographic footprint.
Target Price: Reiterate $800; Rating: One
Panic Point: $600
RISKS: Industry and economic risk, competition and competitive pressures, and acquisition risk.
Universal Display OLED; $154.46; 1,388 shares; 4.10%; Sector: Technology
UPDATE: After moving lower in March and April, shares of Universal Display OLED rebounded in the double digits in May, and that move continued in June. For Q2 2025, OLED shares were up low double digits, besting the S&P 500, and that makes our move on April 14 to pick up shares at $116.27 a smart one. We made that decision by following the data, which included signs confirming the shift toward organic light-emitting diode displays across smartphones, monitors, TVs, and other applications. Research firm Omdia sees organic light-emitting diode adoption in smartphones growing in the mid-single-digits this year to 848 million units; tablets, laptops, and monitors up 16% year-over-year to 27 million units; and TVs using the display technology rising 4.5% year-over-year to 7.1 million units. Those figures, as well as adoption in the auto market and others, keep us bullish on OLED shares. We will continue to follow the company’s commercialization and licensing efforts for its blue organic light-emitting diode material, which, mixed with its red and green solutions, means the white light market is now in sight. Organic light-emitting diodes following the same path of light-emitting diodes (LEDs) into the white and general lighting market is reason to remain long-term bullish on OLED shares. In early June, Universal’s management presented at the Bank of America Global Technology Conference. While the presentation contained few surprises given our familiarity with the company, the management team did say that the current quarter is tracking a little better than expected. Around that time, Goldman Sachs added OLED shares to its U.S. Conviction List with a Buy rating and a target of $183. Should market forces drag OLED shares lower, we see strong support at $143-$144, which is the intersection of their 50-day and 100-day moving averages.
June Monthly Price Change: 7.8%; Yield: 1.2%
INVESTMENT THESIS: Universal Display focuses on the development and commercialization of organic light-emitting diode (OLED) technologies and materials for use in display and solid-state lighting applications. OLED displays are capturing a growing share of the display market, especially in the mobile phone, television, monitor, wearable, tablet, notebook, personal computer, augmented reality (AR), virtual reality (VR), and automotive markets. This adoption reflects advantages over competing display technologies concerning power efficiency, contrast ratio, viewing angle, video response time, form factor, and manufacturing cost. Universal Display's business strategy is to develop new OLED materials and sell existing and new materials to product manufacturers for display applications, such as mobile phones, televisions, monitors, wearables, tablets, portable media devices, notebook computers, personal computers, and automotive applications, and specialty and general lighting products. The company also looks to license its OLED material, device design, and manufacturing technologies to those manufacturers. As such, Universal Display has a significant portfolio of proprietary OLED technologies and materials with more than 5,500 patents issued and pending worldwide.
Target Price: Reiterate $200; Rating: One
Panic Point: $125
RISKS: Patent and Intellectual property protection; maintaining OLED manufacturing and customer relationships; technology risk; market risk.
Vulcan Materials Company VMC; $260.82; 613 shares; 3.05%; Sector: Building Materials
UPDATE: After climbing more than 12% in April, shares of Vulcan Materials VMC finished May and June little changed. Despite that treading water, the net gains allowed them to finish the first half of 2025 nicely ahead of the overall market. We suspect that flattish performance in May and June can be attributed to weather-related concerns, a headwind for concrete and aggregate construction. As we’ve seen in the past, such weather tends to be a temporary factor. We continue to view the housing market as a headwind for Vulcan given affordability factors and economic uncertainty. However, infrastructure spending and private non-residential construction, such as data centers and other buildings, remain a very nice tailwind for construction activity. Paired with opportunistic but disciplined pricing, we see Vulcan’s adjusted EBITDA expanding meaningfully during its seasonally strongest quarters. For now, we’re going to keep our VMC target at $310. When we digest the May Construction Spending report, which will be published on July 1, we will look to revisit our VMC price target. We’ll do that again during the June quarter earnings season when companies like Caterpillar, Terex, Tutor Perini, and others update their guidance for H2 2025 and beyond.
June Monthly Price Change: -1.6%; Yield: 0.7%
INVESTMENT THESIS: Vulcan Materials operates primarily in the U.S. and is the nation's largest supplier of construction aggregates (primarily crushed stone, sand, and gravel), a major producer of asphalt mix and ready-mixed concrete, and a supplier of construction paving services. Its products are the indispensable materials used in building homes, offices, places of worship, schools, hospitals, and factories, as well as vital infrastructure including highways, bridges, roads, ports and harbors, water systems, campuses, dams, airports, and rail networks. Ramping spending associated with the Biden Infrastructure Law should drive demand for Vulcan's products over the coming years. Vulcan has historically complemented its organic growth prospects by acquiring businesses to expand its geographic reach and product scope. Since 2014, the company has acquired more than two dozen companies, including the 2021 acquisition of U.S. Concrete. That combination has allowed the company to deliver steady top and bottom-line growth over the last decade, with only a modest decline when the pandemic hit in 2020.
Target Price: Reiterate $310; Rating: One
Panic Point: $225
RISKS: General economic and business conditions; dependence on the construction industry; timing of federal, state, and local funding for infrastructure; changes in the level of spending for private residential and private nonresidential construction.
TWOS
American Express AXP; $318.98; 580 shares; 3.53%; Sector: Financial Services
UPDATE: After falling nearly 10% in the March quarter and drifting lower in April amid questions over consumer spending, shares of American Express AXP roared back in May and June, leaving them up more than 18% in Q2 2025, well ahead of the analogous move for the S&P 500. Comparing the findings of the May Retail Sales report against Visa’s May SMI findings suggests consumer spending on services has likely held up better than expected. That was confirmed when we looked at Table 1 of the May Personal Spending report, and found personal outlays on services rose 0.1% compared with April vs. the 0.9% decline recorded for retail spending found in the May Retail Sales report. The same Table 1 showed that for the first two months of Q2 2025, compared to the first two months of Q1 2025, spending on services was 1.0% higher. We see that as constructive for the Pro Portfolio’s position in American Express. Combined with telegraphed plans to majorly update its U.S. consumer and business Platinum cards later this year, a move that could lead to a higher membership fee, win new members, or both, it’s looking like we will need to revisit our AXP price target. Much like at Costco, we prefer the membership-driven business model and what it means for pre-tax income at Amex compared to the more transactional-led one at Visa and Mastercard. With AXP shares in overbought territory following their near 40% move off their early April lows, you should not chase AXP shares at current levels until we have more details on its Platinum card plans. For that reason, on June 30, we downgraded the shares to a Two rating from a One. In addition to its card refresh efforts, potential catalysts for the shares we’re watching include the impact of Trump’s fiscal stimulus bill as well as indirect impacts from trade deals. During the March quarter, American Express repurchased 2.3 million common shares at an average price of $297.37, and under its current program, it is still authorized to repurchase another 72.9 million. When Amex reports its June-quarter results, we would not be surprised to learn Amex flexed that program during April.
June Monthly Price Change: 8.5%; Yield: 1.0%
INVESTMENT THESIS: American Express is a globally integrated, membership-driven payments company, providing customers with access to products, insights, and experiences that enrich lives and build business success. The company has four reportable operating segments: U.S. Consumer Services (USCS), Commercial Services (CS), International Card Services (ICS), and Global Merchant and Network Services (GMNS). American Express targets the premium consumer space by continuing to deliver membership benefits that span our customers’ everyday spending, borrowing, travel, and lifestyle needs, expanding its roster of business partners around the globe, and developing a range of experiences that attract high-spending customers. In 2024, the company’s net card fee revenue accounted for 65% of its pre-tax income, which we see providing a differentiated business model that should continue to grow as Amex wins new card members and drives its average fee per card higher.
Target Price: Reiterate $310; Rating: Two
Panic Point: $255
RISKS: Slowdown in consumer spending, competition, membership growth, merchant acceptance, lack of new product innovation.
Apple AAPL; $205.17; 825 shares; 3.25%; Sector: Technology
UPDATE: Apple AAPL shares were up modestly in June, leaving them a drag on the Pro Portfolio for the quarter following their April and May declines. As we said in our April and May Monthly Roundups, tariff uncertainty will keep a lid on AAPL shares, and that certainly proved out in June. While Apple will look to minimize the impact of tariffs by flexing its world-class supply chain, management conceded there will be some margin impact on its Product business. Apple’s WWDC event was largely as expected given pre-event reports about upcoming software features, but we continue to see the key to AAPL shares being the AI-led upgrade cycle. This will come in phases and likely means a protracted upgrade cycle. We’ve seen the power of that upgrade cycle in the past, and that keeps us long-term bullish on AAPL shares, but near-term, we could very well see them trail the market. During its late June earnings report, memory company Micron shared it sees the smartphone market growing in the low-single digits this year, which implies stronger second-half volumes compared to the first half of the year. As we move through the June-quarter earnings season and beyond, we’ll track comments and monthly reports from key suppliers using them to revisit H2 2025 smartphone volume expectations. Should those findings point to stronger-than-expected demand, it could be a catalyst for us to revisit our Two rating. Another would be if Apple delivers a “wow factor” later this year with its usual fall iPhone hardware announcements. At that time, we’ll be eyeing not only the feature set of each model but price points, which could move higher as Apple contends with tariffs and the final details of any trade deals that get inked between now and then. Over the last several weeks, AAPL shares have been hugging the 50-day moving average, and any surprise good news could lead them to the 100-day moving average near $213. A more pronounced move would likely require a larger catalyst that would jumpstart either Apple’s AI capabilities or the iPhone upgrade cycle.
June Monthly Price Change: 2.2%; Yield: 0.5%
INVESTMENT THESIS: While we acknowledge that near-to-midterm performance remains heavily influenced by iPhone sales, the dynamic is shifting as investors finally place greater emphasis on Services growth. We are bullish on the 5G upgrade cycle and believe longer-term upside will continue to come as Services revenue grows its share of overall sales. Services provide for a recurring revenue stream at higher margins, a factor that serves to reduce earnings volatility while allowing for a higher percentage of sales to fall to the bottom line; as a result, we believe that Services growth and the installed base, are much more important than how many devices the company can sell in each 90-day period. In addition to improved profitability, we also believe the transparent nature of this revenue stream will demand an expanded price-to-earnings multiple as segment sales grow. Furthermore, we believe that Apple's desire to push deeper into the healthcare arena will help make its devices invaluable as more life-changing features are added and the company works to democratize health records.
Target Price: Reiterate $235; Rating: Two
Panic Point: $177
RISKS: Slowdown in consumer spending, competition, lack of new product innovation, elongated replacement cycles, failure to execute on Services growth initiative.
Axon Enterprise AXON; $827.94; 168 shares; 2.66%; Sector: Aerospace & Defense
UPDATE: There is little question that our decision to bring shares of Axon AXON to the Pro Portfolio in late February and build that position in March was a good move. We say that because the shares were a strong performer in April, May, and June, with the cumulative Q2 2025 increase topping 50%. That makes AXON one of the Pro Portfolio’s top performers alongside Palantir. Coming off Axon’s early June presentation at the William Blair Growth Stock Conference, we raised our price target for the shares to $825 from $750 to reflect AI adoption and enterprise penetration. As we get more confirmation of those, we’ll look to revisit our target accordingly. During the conference Axon management reiterated that the largest win in the company’s history occurred in the prior quarter with an enterprise customer. Management framed the enterprise opportunity this way — Walmart alone has 2.1 million retail workers with 1.6 million in the U.S. compared to ~ 900,000 cops in the U.S. and about 150,000 federal law enforcement officers. We expect to have more clarity around Axon’s recent enterprise win in the coming months, but during the presentation, the management team shared that the customer is using its products to “consolidate 300,000 video streams across their warehouses, their trucks, their logistics hubs, et cetera., in their retail locations and so forth.” While we could speculate that the customer is Amazon, the comment on retail locations suggests it could be Walmart or one of its large retail competitors. Management also discussed how it plans to bundle its growing list of AI products into a recurring revenue stream. Currently, Axon has six AI products available, which are being sold for $200 per month, even though the a la carte pricing for those tools is over $200 per month. Like its existing DraftOne, BriefOne, and real-time translators, these AI products are designed to drive productivity at a time when police force applications are falling, leading to staffing and coverage shortages. The adoption of those and other AI tools should foster growth for Axon’s higher-margin recurring revenue services, including cloud. Exiting the March quarter, the company’s annual recurring revenue during the March quarter grew 34% year over year to $1.1 billion, and exiting the quarter, the company’s deferred revenue topped $1 billion, while its future contracted bookings rose to $9.9 billion compared to $7.0 billion exiting the year-ago quarter. For us, the Axon story continues to be one centered on the mix shift toward the higher-margin, recurring revenue services business, as well as continued growth for its hardware business in federal, corporate, and international markets. While we see further upside ahead for the company’s business and our shares, like more than a few others, AXON shares have crossed into overbought territory, and that means holding off on new capital in the shares. In keeping with our Two rating, a pullback could bring an opportunity, and we’ll be watching for one that fits the bill.
June Monthly Price Change: 10.3%; Yield: 0.0%
INVESTMENT THESIS: Axon Enterprise develops, manufactures, and sells conducted energy devices and cloud-based digital evidence management software designed for use by law enforcement, corrections, military forces, private security personnel, and private individuals for personal defense. The company operates in two segments: Taser (recently renamed Connected Devices) and Software & Sensors (recently renamed Software & Services). Taser develops and sells CEDs used for protecting users and virtual reality training. Software & Sensors manufactures fully integrated hardware and cloud-based software solutions such as body cameras, automated license plate reading, and digital evidence management systems. Axon delivers its products worldwide and gets most of its revenue from the United States. According to Mordor Intelligence, the wearable and body-worn cameras market on its own was valued at $1.62 billion in 2020 and is expected to reach $424.63 billion by 2026. Public safety organizations are increasingly adopting cloud solutions, leading to significant spending in this area. The digital spending in public safety is projected to reach $201 billion by 2027.
Target Price: Reiterate $825; Rating: Two
Panic Point: $600
RISKS: Manufacturing and supply chain, competitive factors, government regulation, technology change.
Bank of America Corp. BAC; $47.32; 4,410 shares; 3.98%; Sector: Financial Services
UPDATE: After moving lower for the first months of 2025, Bank of America BAC shares rallied back and then some during May and June, closing out the first half of 2025 in positive territory and nicely ahead of the S&P 500. We suspect BofA will continue to make inroads against smaller, regional banks, allowing continued growth in its overall account base, a lead generator for its wealth management business, and vice versa. However, it is the operating leverage as investment banking activity rebounds that is the greater reason for our owning the shares in the Pro Portfolio. And that is what we saw in May and June as Voyager Technologies (VOYG), Chime Financial (CHYM), and Circle Internet Group (CRCL) joined the ranks of successfully priced IPOs that include CoreWeave (CRWV), Omada Health (OMDA), Circle Financial (CRCL), Hinge Health (HNGE), MNTN (MNTN), and eToro Group (ETOR). The ensuing strength in BAC shares led us to downgrade them to a Two rating on June 12. As more IPOs come to market and M&A deals are announced, we’ll revisit our BAC price target and stock pickup points as needed. We may fine-tune our BAC price target following the company successfully passing the Fed’s 2025 bank stress tests, a happening that could translate into an increase in BofA’s quarterly per share dividend. With BAC shares approaching our $50 target and currently in overbought territory, you should hold off putting fresh capital to work in them.
June Monthly Price Change: 7.2%; Yield: 2.2%
INVESTMENT THESIS: Bank of America is one of the world's leading financial institutions, serving individual consumers, small and middle-market businesses, and large corporations with a full range of banking, investing, asset management, and other financial and risk management products and services. The company provides unmatched convenience in the United States, serving approximately 67 million consumer and small business clients with approximately 3,900 retail financial centers, approximately 16,000 ATMs, and award-winning digital banking with approximately 56 million verified digital users. Bank of America is a global leader in wealth management, corporate and investment banking, and trading across a broad range of asset classes, serving corporations, governments, institutions, and individuals around the world. Bank of America offers industry-leading support to approximately 3 million small business households through a suite of innovative, easy-to-use online products and services. The company serves clients through operations across the United States, its territories, and approximately 35 countries. From a reporting perspective, the company's business breaks down as follows: Net Interest Income breakdown: Consumer Banking 57%, Global Banking 23%, Global Wealth & Investment Management 14%, and Global Markets 6%; Income Before Tax breakdown: Consumer Banking 42%, Global Banking 27%, Global Wealth & Investment Management 16%, and Global Markets 15%. Bank of America pays a quarterly dividend of $0.26 per share, up from $0.18 a few years ago.
Target Price: $50; Rating: Two
Panic Point: $37
RISKS: Financial markets, fiscal, monetary, and regulatory policies, economic conditions, and credit ratings.
Dutch Bros BROS; $68.37; 2,370 shares; 3.09%; Sector: Consumer Cyclical
UPDATE: The second quarter was a bit of a seesaw for Dutch Bros BROS shares. While they ultimately closed the quarter with a gain in the low double digits, bringing their H1 2025 return to more than 30%, BROS shares traded off in June. Part of that decline likely reflected the lack of company news during the month, as well as some short-term-minded folks taking profits. We don’t blame them; remember, we took some very profitable BROS chips off the table in late May. However, we continue to favor the long game with BROS shares as the company continues to expand its footprint. Exiting the quarter, Dutch Bros had 1,012 locations, plans to add 130 more shops this year, and reiterated its target of 2,029 by 2029. For context, Starbucks had more than 17,000 locations across the United States, exiting the March quarter. That reaffirms our view that Dutch Bros has ample room to expand its footprint in the coming years without risking oversaturation, and the targeted food rollout for 2026 should be an added top-line driver. We see very strong support for BROS shares near $67 from both the 50 and 100-day moving averages. Should the shares positively test support at that level, that would give us reason to revisit our current Two rating and potentially scoop up additional shares.
June Monthly Price Change: -5.3%; Yield: 0.0%
INVESTMENT THESIS: Dutch Bros is an operator and franchisor of drive-thru shops that focus on serving high-quality, hand-crafted beverages with unparalleled speed and superior service. Coffee-based beverages make up ~50% of the menu mix, and ~25% of the menu mix is based upon the company’s proprietary Blue Rebel energy drink, which is highly customizable with flavors and modifiers and can be served blended or over ice. The energy platform helps unlock the afternoon daypart and broadens the company’s appeal. The remaining 25% of the menu mix is a wide variety of teas, lemonades, sodas, and smoothies. The company’s west-to-east expansion is a time-tested strategy that should drive revenue and EPS growth over the next several years. Leveraging that footprint expansion and low-single-digit comp sales growth, management reiterated its long-term guidance of around 20% annual revenue growth. Helping support that guidance, the company confirmed it will introduce an expanded food menu in 2026. Dutch Bros is slated to enter the consumer-packaged goods (CPG) space in a deal with Trilliant Food & Nutrition.
Target Price: Reiterate $85; Rating: Two
Panic Point: $55
RISKS: Commodity risks, labor costs, interest rate risk, and inflation.
First Trust Nasdaq Cybersecurity ETF CIBR; $75.58; 2,028 shares; 2.92%; Sector: Cybersecurity
UPDATE: Each time we note ripped-from-the-headlines confirmation points for the Pro Portfolio and its underlying strategy, one constant is the signals for cybersecurity demand. Artificial intelligence will super-charge familiar threats in 2025 and beyond, putting new wrinkles on old security challenges such as phishing, insider threats, and ransomware. Research firm Gartner expects that cybersecurity spending will increase 15% in 2025, from $183.9 billion to $212 billion. We continue to favor the diversified exposure CIBR brings to the Pro Portfolio, which complements the cybersecurity efforts at Elastic, Microsoft, and Alphabet. As we see key constituents of this ETF raise their 2025 and 2026 raise their outlooks to reflect consistent demand for cybersecurity services, we’ll continue to revisit our price target. CIBR recently tagged new all-time highs on some very heavy turnover, a sign that big money managers are entering the ETF aggressively. The indicators are strong and bullish, the MACD is setting up for a buy signal, while relative strength remains robust. A pullback to the 20-day moving average (circa $73) would not be a surprise, and there is better support at $72 (February high), but eventually, from a technical perspective, we see this ETF moving out towards $100. That would build on the impressive high teens gain the ETF experienced during the June quarter.
June Monthly Price Change: 5.2%; Yield: 0.0%
INVESTMENT THESIS: The First Trust Nasdaq Cybersecurity ETF seeks investment results that correspond generally to the price and yield (before the fund's fees and expenses) of an equity index called the Nasdaq CTA Cybersecurity Index. The Nasdaq CTA Cybersecurity Index is designed to track the performance of companies engaged in the cybersecurity segment of the technology and industrial sectors. It includes companies primarily involved in the building, implementation, and management of security protocols applied to private and public networks, computers, and mobile devices to protect the integrity of data and network operations. To be included in the index, a security must be listed on an index-eligible global stock exchange and classified as a cybersecurity company as determined by the Consumer Technology Association. Each security must have a worldwide market capitalization of $250 million, have a minimum three-month average daily dollar trading volume of $1 million, and have a minimum free float of 20%.
Target Price: Reiterate $78; Rating: Two
Panic Point: $63
RISKS: Cybersecurity spending, technology, and product development, the timing of the product sales cycle, new products, and services in response to rapid technological changes and market developments, as well as evolving security threats.
Labcorp Holdings Inc. LH; $262.51; 710 shares; 3.56%; Sector: Healthcare
UPDATE: As the dust settled from President Trump’s April 2 “Liberation Day,” shares of Labcorp LH benefited as their domestically centered business and the powerful demographic wave behind it made the shares a safety play. While we don’t disagree with those attributes, it overlooks the company’s multi-faceted growth strategies, which include nip-and-tuck acquisitions and expanding its testing capabilities. Entering June, Labcorp expanded its oncology portfolio with new test offerings for solid tumor and hematologic malignancies and enhanced biopharma solutions designed to accelerate clinical trials and companion diagnostic development. In mid-June, the company launched Labcorp Whole Health Solutions to support the growing needs of functional medicine, integrative medicine, and primary care providers in delivering holistic care. It’s moves like those paired with expanding relationships with medical offices and hospitals that should drive steady revenue and earnings growth in the coming quarters. Those same moves improve the company’s position to benefit from the greater medical needs of the aging population. That keeps us bullish on the shares even though they have risen by low double digits so far this year, making them a standout against the overall stock market. Because we are disciplined investors, should we see the shares bump up or move past our $265 target in the near term, we may opt to lock in a slice of gains. Based on the duration of tariffs and potential trade deals, there could be some incremental EPS upside in H2 2025. As we get more clarity on that front, we’ll revisit our price target as needed.
June Monthly Price Change: 5.4%; Yield: 1.1%
INVESTMENT THESIS: Labcorp is a global leader in innovative and comprehensive laboratory services that provide vital information to help doctors, hospitals, pharmaceutical companies, researchers, and patients make clear and confident decisions. By leveraging its diagnostics and drug development capabilities, the company provides insights and accelerates innovations to improve health and improve lives. The company is organized under two segments, consisting of Diagnostics Laboratories (Dx), which includes routine testing and specialty/esoteric testing, and Biopharma Laboratory Services (BLS), consisting of Early Development Research Laboratories and Central Laboratory Services. Our attraction to LH shares stems from the combination of the aging population driving diagnostic testing growth and the increasing array of diagnostic testing as well. That combination is expected to drive the healthcare testing services market to $12.6 billion by 2029, from $7.4 billion in 2024, according to Markets and Markets. To augment its position in oncology, women's health, autoimmune diseases, and neurology, the company has been expanding through acquisitions and partnerships with health systems and regional, local labs.
Target Price: Reiterate $265; Rating: Two
Panic Point: $228
RISKS: Macroeconomic factors, changes in healthcare reimbursement models and products, government regulations, product discontinuations or recalls.
Meta Platforms META; $738.09; 283 shares; 3.99%; Sector: Communication Services
UPDATE: Shares of Meta META continued to climb in June, adding significantly to their double-digit gains in May. That has us feeling very good about the moves we made in mid-April and mid-May to build the Pro Portfolio’s position at $555.17 and $623.57. The catalysts for the more than 25% move in June alone included reports that the company intends to fully automate the making of ads using AI by the end of next year. Using the ad tools Meta is developing, a brand could present an image of a product it plans to promote with a budgetary goal, and AI would make the entire ad, including images, video, and text. The system would then decide which Instagram and Facebook users to target. We see that streamlining the ad process and suspect such service would come with a premium price tag that would also help goose margins and EPS growth. Mid-June, we learned Meta will finally look to monetize the almost 3 billion WhatsApp users by allowing ads on the platform. As we discussed on June 16, when we see signs of this effort starting, based on what we learn, it would be another reason for us to revisit our META price target down the line. Meta also made moves to improve its AI competitive position in June by agreeing to pay $14.3 billion for a 49% stake in AI startup Scale AI, which offers data services to help train companies' AI models. A key aspect of the deal includes Scale CEO Alexandr Wang joining Meta to head its “superintelligence” team focused on artificial general intelligence. Near the end of June, reports were circulating that Meta is attempting to raise $29 billion to help fund its ambitious artificial intelligence data center buildout. This could lead Meta to once again upsize its AI and data center capital spending plans for 2025 and beyond, which would be a positive catalyst for the Pro Portfolio’s shares of Marvell and Nvidia. We continue to see Meta and its multiple platforms benefiting from AI adoption, which means we are inclined to remain owners of the shares. However, with META shares crossing into overbought territory following their astonishing 50% move since their April low, we may be inclined to lock in a slice of gains even as we contemplate lifting our $725 price target.
June Monthly Price Change: 14.0%; Yield: 0.3%
INVESTMENT THESIS: Meta segments its business between Family of App Products, which includes Facebook, Instagram, Messenger, Threads, and WhatsApp, and Reality Labs Products, which includes its metaverse and investments and future product R&D. Family of Apps accounts for ~99% of company revenue and 100% of company operating profit. Substantially all of Meta’s revenue is currently generated from advertising on Facebook and Instagram. Family daily active people (DAP) was 3.43 billion on average for March 2024. Meta expects to spend $64 billion to $72 billion on capex in 2025, a significant increase year over year, with the majority of this spending focused on AI infrastructure and initiatives. Meta is positioned to benefit from the ongoing shift toward digital advertising and the adoption of AI across its product offerings. We recognize Meta is ramping up capital spending as part of the current AI arms race, but we see that as an investment that should drive productivity in its core advertising business. As the company harvests that investment, we could see a step up in margins, much like we saw in 2023.
Target Price: Reiterate $725; Rating: Two
Panic Point: $570
RISKS: Ability to add and retain users and user engagement; marketing spend; new products or changes to existing ones; competitive risk, geopolitical risk.
Microsoft Corp. MSFT; $497.41; 370 shares; 3.53%; Sector: Technology
UPDATE: Microsoft MSFT shares continued to soar in June, and combined with their performance in April and May, this brought their Q2 2025 gain to more than 30%. Along the way, the shares set several new all-time highs, and we upped our MSFT target to $515 from $480 in late June. As we made that adjustment, recognizing the overbought status of the shares, we also took advantage of the more than 35% move in MSFT shares since their April low to lock in a slice of that gain. Following that trade, we continued to have a sizable position in MSFT shares, one we intend to own as AI adoption progresses from its current early innings stage. In recent quarters, Microsoft’s AI and cloud business has been capacity-constrained, but as that is being addressed, especially at Azure, we are seeing the expected re-acceleration emerge, one that Microsoft management telegraphed. That pushes back strongly on the concerns over the company’s AI competitive position, while the reiteration of its 2025 capital spending plans also puts to rest other chatter that plagued the shares during April. When we stand back and look at Microsoft’s March quarter and its guidance, the message to walk away with is that the strength in AI and cloud that permeates across multiple business lines and is still somewhat capacity-constrained, is strong enough to more than offset the near-term uncertainty in the company’s hardware business. That same hardware business should benefit from the phase out of Windows 10 and the AI PC upgrade cycle that keeps us bullish on Qualcomm shares. As AI adoption in the enterprise and elsewhere accelerates, we’ll revisit our MSFT price target.
June Monthly Price Change: 8.0%; Yield: 0.7%
INVESTMENT THESIS: We believe the cloud to be a secular growth trend and that the upside to the shares will result from Microsoft's hybrid cloud leadership as the company grabs market share in this expanding industry. While companies may look to build out multi-cloud environments, Microsoft's Azure offering will be a prime choice thanks to its decision to provide the same "stack" used in the public cloud to companies for their on-premises data centers. Additionally, we would note that hybrid environments are currently the preference for most companies because they allow them to maintain critical data in-house while taking advantage of the agility and scalability provided by public clouds. Outside of the cloud opportunity, we maintain a positive view on the company's growing gaming business, which we believe is becoming an increasingly prominent factor in the Microsoft growth story as gaming becomes more mainstream, management works to convert its gaming revenue from one-time license purchase to a recurring subscription model and as technologies like augmented/virtual reality evolve. Finally, as it relates to LinkedIn and other subscription-based services such as O365 and various Dynamics products, we continue to value them highly for their recurring revenue streams, which, we remind members, provide for greater transparency of future earnings.
Target Price: $515; Rating: Two
Panic Point: $385
RISKS: Slowdown in IT spending, competition, cannibalization of on-premises business by the cloud.
Morgan Stanley MS; $140.86; 1,462 shares; 3.93%; Sector: Financial Services
UPDATE: In mid-May, we boosted our price target for Morgan Stanley MS to $140 from $120, and following the improving outlook for trading volumes and investment banking activity, we boosted that target to $145 on June 12. As we made that change, we also downgraded MS shares to a Two rating from One, given modest upside to our revised target following the sharp move in MS shares in May and the first half of June. Around that time, the IPOs for Voyager Technologies (VOYG) and Chime Financial (CHYM) priced above their target range and subsequently moved higher. The same has since happened with the shares of Circle Internet Group (CIRCL) as they joined the ranks of recent IPOs like CoreWeave (CRWV), Omada Health (OMDA), Circle Financial (CRCL), Hinge Health (HNGE), MNTN (MNTN), and eToro Group (ETOR). Comments from Morgan Stanley and others in recent weeks point to a rich backlog of transactions, which suggests that more M&A deals and IPOs are on the table. As more IPOs come to market and M&A deals are announced, we should see financial leverage tied to Morgan’s investment banking business benefit its bottom line. Therefore, as more deals are had, we’ll revisit our MS price target and stock pickup points as needed. We may fine-tune our MS price target following the company successfully passing the Fed’s 2025 bank stress tests, a happening that could translate into Morgan’s quarterly per share dividend moving higher. As we close the books on H1 2025, MS shares are up more than 10% year-to-date, making them a strong performer for us and against the S&P 500’s far more modest gain. However, with the shares well into overbought territory, you should not commit fresh capital to them at this time.
June Monthly Price Change: 10.0%; Yield: 2.6%
INVESTMENT THESIS: Morgan Stanley reports in three business segments: Institutional Securities (42% of trailing 12-month revenue, 38% of trailing 12-month Income Before Tax), Wealth Management (48%, 55%), and Investment Management (10%, 6%). While the IPO window has yet to reopen, the potential IPO class for 2025 continues to build with recent additions including Klarna and StubHub. That would be a boon to private equity firms and others that have been nursing IPO candidates during the dark period and a positive for Morgan Stanley's investment banking business. Expected deregulation under the Trump administration is a potential catalyst for Morgan's M&A business. Meanwhile, folks continuing to be behind in retirement savings bodes well for Morgan Stanley's wealth management business in the coming quarters, while continued market volatility bodes well for its equity trading business.
Target Price: $145; Rating: Two
Panic Point: $112
RISKS: Market and interest rate risk, credit risk, country risk, and operational risk, including cybersecurity.
Palantir Technologies PLTR; $136.32; 822 shares; 2.14%; Sector: Financial Services
UPDATE: Even though the overall rise by Palantir PLTR in June was modest, the shares remained a notable outperformer for Q2 2025 with their more than 50% move higher. The fundamental reason for owning PLTR is to capture the benefits of the company’s expanding and diversifying customer base, as well as AI adoption to drive productivity. Management’s latest guidance calls for revenue to climb 14% in the second half of 2025 compared to the first half of the year. Also, adjusted operating income is expected to grow at a quicker 16% or higher rate. That means we should see stronger free cash flow in the second half of 2025, as well as margins bounce back. We remain in the relatively early innings of that adoption, and that led us to boost our PLTR price target multiple times during the quarter. The most recent was in mid-June when we boosted it to $140, but with NATO leaders having agreed to increase defense spending to 5% of their countries' GDP by 2035, we boosted our PLTR target to $160 again on June 30. There is reason to think we may need to do that again by the end of July, which is when the Trump administration AI Action Plan is due. The White House is thinking of making July 23 "AI Action Day" to draw attention to the report and show its commitment to expanding the industry. We may get some clues when Trump speaks at an AI and energy event in Pennsylvania slated for July 15. With the next layer of support near $124, if we see PLTR shares retrace near that level, we may be inclined to revisit their current Two rating.
June Monthly Price Change: 3.4%; Yield: 0.0%
INVESTMENT THESIS: Palantir Technologies specializes in big data analytics and builds software platforms that help organizations integrate, analyze, and make sense of vast amounts of data for both commercial and government clients. While much has been made about the company’s exposure to the federal government, its software is used across 90 industries, and the larger global government sector accounted for 55% of revenue last year. The balance was from the commercial sector. While those percentages matched the ones for 2023, Palantir’s customer count jumped to 711 by the end of 2024 from 497 at the end of 2023, nearly double compared to the end of 2023. For 2024, the average revenue across its top 20 customers was $64.6 million, up from $54.6 million in 2023 and $49.4 million in 2022. Commercial remaining deal value (RDV) stood at $1.79 billion exiting 2024, up 49% sequentially and 99% on a year-over-year basis. That equates to about 47% of the expected 2025 revenue. We will continue to monitor Palantir’s RDV and deferred revenue metrics, but in our view, key items to watch will be the continued diversification of its customer base across industries and increasing revenue per customer. Because we are still in the relatively early innings of AI adoption, we are inclined to be long-term owners of PLTR shares. Exiting 2024, Palantir had just over $935 million remaining under its current share repurchase program.
Target Price: $160; Rating: Two
Panic Point: $95
RISKS: Economic and IT budget spending risk, technology risk, competition and competitive pressures, and customer acquisition risk.
SuRo Capital SSSS; $8.21; 13,700 shares; 2.15%; Sector: Financial Services
UPDATE: In late May, we added the shares of SuRo Capital SSSS to the Pro Portfolio’s Bullpen, and on June 4, we called them up to the Bullpen, starting the position off with a cost basis of $6.76 and an $8.25 price target. While SSSS shares moved meaningfully higher since we added them to the Portfolio, we will reiterate that the position is a total return play for us. Because SuRo is a business development company (BDC) and its corresponding dividends are based on net long-term realized gains, upcoming IPO lockup expirations should trigger dividend payments to shareholders. The lockup period for ServiceTitan (TTAN) shares, about 6.3% of SuRo's investment portfolio exiting the March quarter, expired on June 10, while the one for CoreWeave (CRWV), 9.1% of SuRo’s portfolio exiting March, expires in late September. As shares of CoreWeave and ServiceTitan chugged higher in June, we raised our net asset value per share expectation to $8.75 and picked up more shares for the Portfolio. With IPOs gaining further momentum, we could see other companies in its stable come to market, including beverage company Liquid Death and fintech company Plaid. As that potentially happens and corresponding IPO lockup expirations pass, it should translate into additional dividend payments. When SuRo reports its June-quarter earnings, we would be very disappointed if there was no corresponding dividend announcement following the IPO lockup expiration of ServiceTitan shares. That forthcoming earnings report should bring an update on SuRo’s portfolio, including its net asset value, as well as word on any new investments made during the quarter. Because trading volumes for SSSS are normally smaller than other positions in the Portfolio, we will continue to update you on favorable pick-up points. Should we see SSSS shares pull back near the $7.50 level or lower, that would be a nice place for us to add some additional shares, a move that would increase our potential dividend exposure.
June Monthly Price Change: 21.4%; Yield: 0.0%
INVESTMENT THESIS: SuRo Capital is a business development company (BDC) that invests in high-growth, venture-backed private companies. As SuRo monetizes those portfolio investments through either IPO or M&A transactions, it must pay out the majority of its earnings to shareholders in the form of dividends. What’s important to factor into our thinking is that SuRo’s strategy isn’t to hold public company investments but rather to monetize them following the lock-up expiration. Sometimes this can be immediate, and sometimes it can be in stages, but when that monetization occurs, it triggers dividend payments. And because a BDC has to pay out at least 90% of its taxable income through dividends to shareholders, there is the possibility of a special dividend to hit that qualifying threshold late in the year. As we think about this, it means that we should focus on total return with SSSS, which is defined as capital gains in the shares plus dividends received while owning them. What this means is even if we see SSSS shares trade sideways or move lower, depending on the size of the dividend payments in the coming quarters, the position’s total return could still be sizable for the Pro Portfolio. SuRo portfolio holdings at the end of March included CoreWeave (CRWV), ServiceTitan (TTAN), OpenAI, Liquid Death, Whoop, and fintech company Plaid, as well as roughly 30 other holdings.
Target Price: $8.75; Rating: Two
Panic Point: $5
RISKS: Industry and economic risk, competition and competitive pressures, and acquisition risk.
Waste Management WM; $228.82; 620 shares; 2.71%; Sector: Industrials
UPDATE: Shares of Waste Management WM were a drag on the Pro Portfolio in June and a more modest one for Q2 2025. Despite that setback, the shares remained a strong performer on a year-to-date basis, up low double digits compared to mid-single digits for the S&P 500. Waste’s core waste business accounts for 90% of the company’s revenue stream, with the balance coming from the renamed WM Healthcare Solutions business, which houses the acquired Stericycle business. We view the sharp margin difference between the two segments as one of the opportunities for the Waste Management team, with another being further consolidation of the residential waste and medical waste sectors. At the company’s recent 2025 Investor Day, management pegged Waste’s North American waste and recycling market share at 18% of the $125 billion market with ample room for further nip and tuck acquisitions. The team expects to close on more than $500 million of solid waste acquisitions in 2025, and we’ll get an update on that progress on July 29 when Waste reports its quarterly results. Also at the 2025 Investor Day, Waste forecasted its adjusted operating EBITDA will grow at an 11.1% compound annual growth rate to $9 billion in 2027 from $6.5 billion last year and the 2027 market consensus of $8.62 billion. That speaks to management’s ability to wring cost out of acquired businesses as well as its ability to drive pricing. We also see that forecast paving the way for further dividend increases and at some point, the resumption of its share repurchase program. With WM shares falling below their 100-day moving average at $229.38, the next layer of support is the 200-day moving average near $220. Should we see the market trade off, closer to that support level would be a nice place to pick up some WM shares.
June Monthly Price Change: -5.0%; Yield: 1.4%
INVESTMENT THESIS: 2025 will see more nonresidential construction activity because of the Biden Infrastructure Law, but now we can finally factor in activity for the CHIPs Act, which saw its first award this week. Other potential drivers include spending associated with the Inflation Reduction Act, including the much-awaited start of building out a nationwide network of EV charging stations. Alongside that bright outlook for WM's commercial business, automation efforts and pricing power in its sticky residential business should drive margins and EPS generation higher in the coming quarters. Given the fragmented nature of the North American waste and recycling industry, we see ample room for Waste Management to grow its footprint via nip and tuck acquisitions. As it does that, management’s track record of integrating acquired businesses and wringing out costs bodes well for further profit growth. We are in the early days of WM Healthcare Solutions, but we see the business growing as management integrates and cross-sells against its core business and flexes the ability to integrate nip-and-tuck acquisitions as it has at the core waste business. Here, too, we see room to consolidate a fragmented industry, which makes this a natural for Waste Management.
Target Price: $245; Rating: Two
Panic Point: $211
RISKS: Industry and economic risk, competition and competitive pressures, and acquisition risk.
