July Monthly Roundup: Pro Portfolio Regains Its Lead Over the S&P 500
Renewed uncertainty over tariffs and the jobs market makes for a rocky start to August.
You've reached your free article limit
You've read 0 of 1 free Pro articles.
Amid a flurry of quarterly earnings reports, fresh economic data, and the outcome of the Fed’s latest policy decision, we closed the books on July with the S&P 500 rising 2.2%. The Pro Portfolio also gained ground during the month as we put more capital to work, taking advantage of pullbacks and other opportunities. Pushing the market higher and into overbought territory toward the end of July was a combination of trade deals and a June-quarter earnings season, which, so far, was performing better than expected. That included results and guidance from Alphabet GOOGL, Meta META, and Microsoft MSFT that confirmed demand for AI and data center remained robust. Those developments helped tamp down uncertainty levels in the market over the economy and tariffs.
While we enjoyed that market action and the Pro Portfolio benefited, we also voiced our concern about the overbought nature of the market, the Fear and Greed Index getting heady, and the Volatility Index (VIX) flashing extreme complacency. That combination led the market to react strongly to the unexpected decline in job creation found in the July Employment Report on August 1. Adding an extra gut punch were the massive downward revisions to May and June job creation figures that reignited concerns about the economy.
In a somewhat surprising move, or perhaps not, President Trump said he directed his team to fire Bureau of Labor Statistics Commissioner Erika McEntarfer after the bureau issued a weak jobs report on Friday, calling the May and June revisions a “major mistake.”
We can’t make this stuff up.
While we are likely to see Trump’s move raise questions about the veracity of data, we’ll do our best to do what we’ve done — triangulate various data points and sources to get a clear picture of what’s unfolding in the economy. With that in mind, fanning the flames of those renewed concerns about the jobs market, the July Manufacturing PMI report from ISM showed that part of the economy remained in contraction territory for the fifth consecutive month, and inflation pressures remained elevated.
Those developments, along with the latest changes to Trump’s tariff polices and continued plans to introduce tariffs on pharmaceuticals and semiconductors in the weeks to come, led to a shoot first, ask questions environment as trading began in August.
When we encounter times like these, we are going to take a deep breath (or several) and follow the data so as not to be swayed by emotions and make mistakes we may later regret.
We will continue to follow the data, assess the technicals for the market and individual stocks in the Pro Portfolio, and revisit our reasons for holding each position. Fortunately, we continue to see AI and data center capital spending levels moving higher, AI adoption accelerating, cyberattacks still happening, and so on.
As we shared in a Friday Alert to you, over time, we expect calmer heads will prevail, and we aim to be in that camp, but in the meantime, we’ll look to take advantage of mispriced opportunities in the market.
Catching Up on the Portfolio in July
At the end of July, on a year-to-date basis, the S&P 500 was up 7.78%, while the Pro Portfolio was up 8.08% even with 9.8% of its assets in cash. Notable performers for the month included Nvidia NVDA and Palantir Technologies PLTR with their double-digit gains, but even they paled in comparison to the more than 17% move in United Rentals URI. Other positions that outperformed the S&P 500’s 2.2% move higher in July included Amazon AMZN, Eaton ETN, Alphabet GOOGL, Meta META, Marvell MRVL, SuRo Capital SSSS, and Vulcan Materials VMC.
While it’s true that folks like to tout their winners, we acknowledge that a few positions moved against us during July. Among those were Axon Enterprise AXON, Costco COST, Dutch Bros BROS, and the First Trust Nasdaq Cybersecurity ETF CIBR, but as you’ll see below, we put those pullbacks to good use for the Portfolio. Others holdings that underperformed during July included Qualcomm QCOM and Universal Display OLED, which experienced "last-minute" selloffs despite better prospects for H2 2025 and 2026.
We made several trades in the Portfolio during the month, including locking in nice gains early on when American Express AXP shares were overbought. We trimmed back that position at $327.60 and swooped in to buy the shares back near $308 later in the month after Amex reported its Q2 2025 results. On July 10, we picked up more shares of Costco COST, after upgrading it to a One rating on June 30.
The following day, we used the deeply overbought condition to lock in slices of triple-digit gains in Nvidia and United Rentals, taking some chips off the table at $165.51 and $811.37, respectively. We used some of those proceeds to pick up some Axon shares. On July 24, we picked up another batch of Axon and Costco as well as another slug of Dutch Bros. Near the end of the month, we added to our position in the First Trust Nasdaq Cybersecurity ETF CIBR, prompted by research firm Gartner calling for a re-acceleration in cybersecurity spending in the coming quarters.
We did not exit any positions during July, but on July 1, we started a new position in TJX Companies TJX with a Two rating and an initial $137 target. Three weeks later, we bought more shares for the Portfolio, a move that nudged our average cost basis a wee bit lower.
Closing out July and the first trading day of August, the Pro Portfolio held positions in 26 stocks, representing just over 90% of its assets. The balance is in our cash account, which saw a modest bump when SuRo Capital SSSS paid out its latest $0.25 per share dividend on July 31. We expect to see more dividend payments from that business development company as management continues to harvest gains in its investments, as well as from others in the Portfolio.
This Week's Portfolio Videos
We cover a lot of ground during the week in our Daily Rundowns. If you happened to miss one or more of them, here are some helpful links:
Monday, July 28: Why Big Tech Earnings Could Be an Inflection Point for the S&P 500
Tuesday, July 29: Massive Union Pacific Move Benefits These 2 Holdings
Wednesday, July 30: Jobs Data Wows, but a Downer for Rate-Cut Hopes
This Month’s Podcasts and Signals
Big discussions and insights are had during TheStreet Stocks & Markets Podcast, and in Signals, we share for the Pro Portfolio’s strategies. Here are some quick links to those conversations conducted over the last several weeks:
July 2 - Can Markets Head Higher? With Helene Meisler
July 9 - Small Caps & Your Portfolio With Thomas Browne
July 12 - Power-Hungry Google, Ever-Shrinking Snacks, Hung-Over Gen Z, and More News for Investing
July 16 - Inside Big Oil With Prairie Operating Co.’s Ed Kovalik
July 19 - $20 'Prime' Shoppers; Gray New Yorkers; Hacker Hacks; and More Investing News
July 23 - Secrets of Venture Capital With SuRo Capital's Mark Klein
July 26 - Going Gray Online in China, AI on the Menu, KitKat Costs and More News for Investing
Key Global Economic Readings
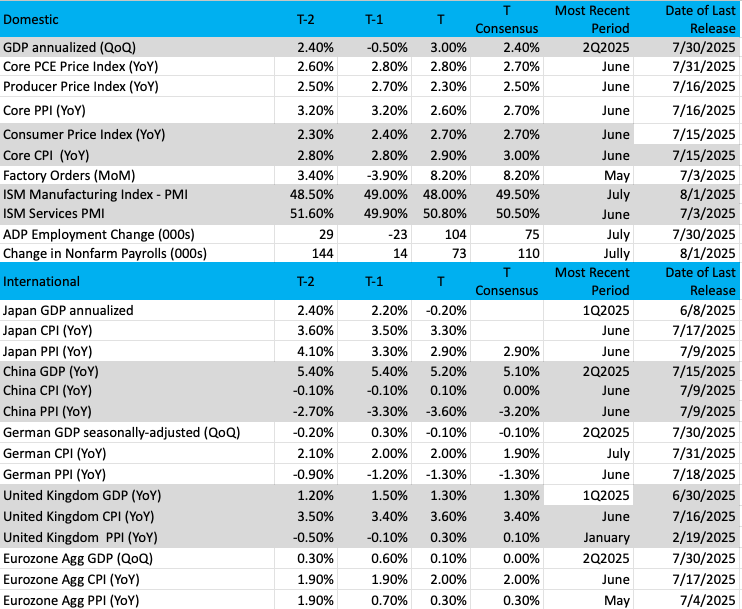
(Note: T is the most recent period, T-1 is the prior period's reading, and T-2 is two periods back, the intent being to illustrate any trends.)
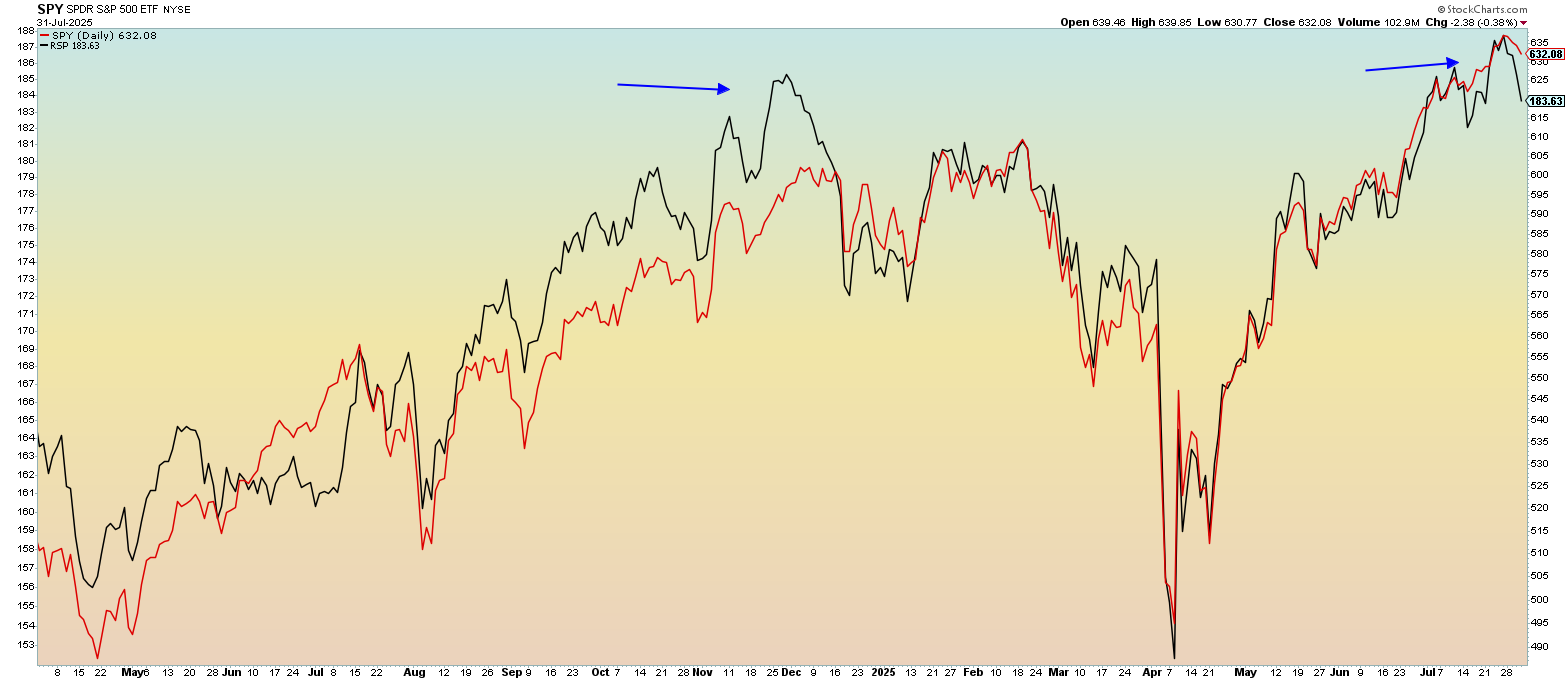
Chart of the Week: S&P 500 — Market Cap Weighted vs. Equal Weighted
It is time for our monthly review of the S&P 500 Index versus the S&P 500 equal-weighted index, by looking at their respective ETFs SPY and RSP. In this comparison, we try to find the reason and rationale for why stocks are moving the way they do, and if we can explain the movements. Currently, there is an important divergence happening, and frankly, it is not bullish.
In recent months, the RSP and the SPY were moving in tandem. This told us that all stocks were moving in concert to the same sounds, a perfect melody. We could see that in the chart as the SPY (black line) and the RSP (red line) were nearly on top of each other.
When the two are separated, it means one ETF is doing better relatively than the other. When the RSP (equal weight) is performing better, it means the broader market is rising, but when the SPY is performing best, it means a few stocks are leading the pack. Remember, the SPY is a cap-weighted index and favors the highest market cap names – think Magnificent Seven stocks and others in the top 25 of the S&P 500.
Well, that is currently the case. RSP has been underperforming over the last several days after strong performances by the largest names like Meta, Microsoft, Nvidia, and Alphabet/Google. It is not healthy for the markets when only a few names are leading the SPY upward. As we saw in late 2024 when that divergence between SPY/RSP was quite noticeable, there was a deep dive that followed.
Can this condition continue for long? Sure, but the longer the divergence exists, the more pain will be felt later when those "hiding out" in the biggest names decide to let them go. Who knows how much pain will be felt because the rest of the market has lost the support of the biggest buyers.
Other charts we shared with you this week were:
Monday, JULY 28: Nasdaq 100 (NDX) - Nasdaq in the Spotlight as Big Week Unfolds for Mag 7
Monday, July 28: Microsoft (MSFT) - Is Microsoft Priced for Perfection?
Tuesday, July 29: Elastic (ESTC) - This 'Purring Cat' Is Making the Most of a Bullish Move
Wednesday, July 30: Amazon (AMZN) - Why It's a Great Time to Be an Amazon Shareholder
Thursday, July 31: Apple (AAPL) - Is the Bar Raised Too High for Apple?
The Week Ahead
On Friday, August 1, the Atlanta Fed’s GDPNow issued an updated forecast of 2.1% for Q3 GDP following the downside surprise found in the July Employment Report. We discussed with you how that employment report contained massive downward job creation revisions for May and June, while the July figure came up short of expectations by a far smaller amount. That explains the modest revision in the GDPNow model to 2.1% vs. the initial forecast of 2.3% published on July 31.
Based on the few and far between data points behind those figures, it’s fair to say it’s a shot in the dark at this point. For that reason, as we move deeper into the second month of Q3 2025, we’re far more interested in the upcoming data that will shape expectations for the current quarter and the second half of the year.
Moving into next week, we’ll get the next piece of the data puzzle from ISM with its July Service PMI data. Given the influence of the domestic service economy on overall GDP, we’ll place much more weight on the details and learnings from that report when it’s out on Tuesday. Granted, what it tells us about job creation will be a tad late considering the timing of the July Employment Report, but the combined July Manufacturing and Service PMI reports and what they say about inflation will be well ahead of the July CPI and PPI reports.
Following Fed Chair Powell’s sobering comments about the prospects for a near-term rate cut on Wednesday, Thursday's June Personal Consumption Expenditures figures moved higher compared to those in prior months. Gaming out recent data and potential trade deals, as we get more July and August data, it’s possible we could see rate-cut expectations slip further from September to October.
Exiting July, the probability seen by the market for a 25-basis point rate cut exiting the Fed’s September meeting fell to 39.2% from nearly 60% before Powell’s comments on Wednesday. However, following the July Employment Report, the market’s expectation for a September rate cut jumped to 80.9%. We could see that probability jostle around based on what we see in next week’s data and the July CPI and PPI reports that follow the week after. As more July data is had, we’ll assess and re-assess the likelihood of a September rate cut, and re-position the Portfolio as needed.
Other economic items we’re tracking next week include the June Consumer Credit report and what it tells us about consumer balance sheets moving into the back-to-school and holiday shopping-filled second half of the year.
Here's a closer look at the economic data coming at us next week:
U.S.
Monday, August 4
· Factory Orders – June (10:00 AM ET)
Tuesday, August 5
· Trade Balance – June (8:30 AM ET)
· S&P Global Final Services PMI – July (9:45 AM ET)
· ISM Services PMI – July (10:00 AM ET)
Wednesday, August 6
· MBA Mortgage Applications Index – Weekly (7:00 AM ET)
· EIA Crude Oil Inventories – Weekly (10:30 AM ET)
Thursday, August 7
· Initial & Continuing Jobless Claims – Weekly (8:30 AM ET)
· Unit Labor Cost & Productivity (Prelim) – Q2 2025 (8:30 AM ET)
· Wholesale Inventories – June (10:00 AM ET)
· EIA Natural Gas Inventories – Weekly (10:30 AM ET)
· Consumer Credit – June (3 PM ET)
International
Tuesday, August 5
· Japan: S&P Global Final Services PMI – July
· China: Caixin Final Services PMI – July
· Eurozone: HCOB Final Services PMI – July
· UK: S&P Global Final Services PMI – July
· Eurozone: Producer Price Index - June
Wednesday, August 6
· Germany: Factory Orders – June
· Eurozone: Retail Sales - June
Thursday, August 7
· China: Imports/Exports – July
· Germany: Imports, Exports, Industrial Production – June
· UK: Bank of England Monetary Policy Decision
Friday, August 8
· Japan: Eco Watchers Survey - July
The second half of this past week was a busy one in terms of the overall pace of quarterly earnings, and for the Portfolio as well. The “fun” will continue next week when more than 1,700 companies report. By the end of next week, roughly half of the S&P 500 basket will have reported, which means updated EPS expectations for H2 2025 should start to firm. We’ll be stalking those updated figures and what they could mean about investor concerns for the market’s valuation.
In that throng of earnings reports are several Portfolio holdings, including Axon AXON, Palantir PLTR, Eaton ETN, and Dutch Bros BROS. With Axon, we’ll be looking for an update on AI adoption and how that is influencing demand as well as pricing and margins for its software and services business. Palantir has been a strong performer and should benefit from overall AI adoption, but the company will need to deliver a strong beat-and-raise quarter. If the market is underwhelmed by what it hears, that could generate an opportunity for us to build our position at better prices.
Turning to Eaton, increasing AI and data center capital spending budgets increases the power crunch being experienced by electric utilities. We should see a favorable outlook at Eaton for that business, but being the data followers we are, we’ll also track rolling capex budgets from those utilities as they report their Q2 2025 results. With that in mind, Duke Energy DUK and its results will be on our list of ones to watch.
Dutch Bros has been a drag on the Portfolio over the last few weeks, and we recently used that pullback to pick up more shares. As they approach oversold status, we are inclined to make another move, provided the company reaffirms its west-to-east expansion timetable.
In between those reports, we’ll continue to drink in comments and updated expectations for others reporting next week and connect the dots back to the Portfolio. Caterpillar CAT TopBuild BLD, Skyworks Solutions SWKS, International Flavors & Fragrances IFF, Construction Partners ROAD, and Motorola Solutions MSI are also on our list of ones to dig into.
Here's a closer look at the earnings reports coming at us next week:
Monday, August 4
· Open: Energizer (ENR), Freshpet (FRPT), Tyson Foods (TSN)
· Close: Axon (AXON), Denny’s (DENN), Hims & Hers Health (HIMS), Navitas Semiconductor (NVTS), Palantir (PLTR), Simon Properties (SPG), Tanger Factory (SKT), Trex (TREX),
Tuesday, August 5
· Open: ADM (ADM), BP (BP), Caterpillar (CAT), Cummins (CMI), Duke Energy (DUK), Eaton (ETN), Ferrari (RACE), LGI Homes (LGIH), Marriott (MAR), Molson Coors (TAP). Pfizer (PFE), TopBuild (BLD), Yum China (YUMC), Yum! Brands (YUM)
· Close: Cirrus Logic (CRUS), Interparfums (IPAR), International Flavors & Fragrances (IFF), Mosaic (MOS), Skyworks (SWKS), Snap (SNAP), Toast (TOST),
Wednesday, August 6
· Open: Capri Holdings (CPRI), Carlyle Group (CG), Dine Brands (DIN), Extreme Networks (EXTR), Kennametal (KMT), McDonald’s (MCD), Nomad Foods (MOMD), Rockwell Automation (ROK), Walt Disney (DIS)
· Close: Airbnb (ABNB), DoorDash (DASH), Dutch Bros (BROS), elf Beauty (ELF), Fortinet (FTNT), Jack in the Box (JACK), Lyft (LYFT), Sony (SONY), Uber (UBER), Zillow (ZG),
Thursday, August 7
· Open: Construction Partners (ROAD), CyberArk (CYBR), DataDog (DDOG), Eli Lilly (LLY), Granite Construction (GVA), Hanesbrands (HBI), Installed Building Products (IBP), Martin Marietta (MLM), Parker Hannifin (PH), Ralph Lauren (RL), Restaurant Brands (QSR), Shopify (SHOP), Warner Bros. Discovery (WBD), Warner Music (WMG)
· Close: Alarm.com (ALRM), AMN Healthcare (AMN), Block (XYZ), Chime (CHYM), Con Edison (ED), Insulet (PODD), Motorola Solutions (MSI), MP Materials (MP), Synaptics (SYNA), Trade Desk (TTD)
Friday, August 8
· Open: American Axle (AXL), Lamar Advertising (LAMR), Under Armour (UAA), Wendy’s (WEN).
Portfolio Investor Resource Guide
· Economic Data: Here's a List of Links to the Key Economic Data We Closely Watch
· Investing Terminology: 16 Key Terms Club Members Should Know
· 10-Ks: Want to Know About a Stock? Read the Company's Reports
· 10-Qs: Unlock the Numbers and Key Information Behind Your Stock With the 10-Q
· Income Statement: Our Cheat Sheet to Understanding This Financial Document
· Balance Sheet, Cash Flow Statements, and Dividends: How to Know If a Company Is Off-Kilter? Read Its Balance Sheet
· Valuation Metrics: Everyone Wants a Value. Here's How Investors Can Find
· Thematic Investing 101 Webinar
The Portfolio Ratings System
1 - Buy Now (BN): Stocks that look compelling to buy right now.
2 - Stockpile (SP): Positions we would add to on pullbacks or a successful test of technical support levels.
3 - Holding Pattern (HP): Stocks we are holding as we wait for a fresh catalyst to make our next move.
4 - Sell (S): Positions we intend to exit.
ONES
Amazon AMZN; $234.11; 881 shares; 3.89%; Sector: Consumer Discretionary
UPDATE: After moving lower during the first four months of the year, Amazon AMZN shares rebounded in a strong fashion in May and June, with that strength continuing in July. That sharp move from the April low near $165 to roughly $235 ahead of the company’s June-quarter results on July 31 set a high bar. While Amazon’s quarterly results beat top-line and bottom-line consensus forecasts, as we saw it, two issues weighed on the shares as we began August. They were the company’s profit guidance for the current quarter, and the slower rate of cloud revenue growth in the June quarter compared to Alphabet and Microsoft. As we reviewed in our Alert analyzing the quarter and breaking down Amazon’s outlook, when the company has leaned in and invested in its businesses, the subsequent market reaction that has led to a selloff in AMZN shares has resulted in nice pick-up points for patient investors. AWS continues to be capacity-constrained, and there is a degree of lumpiness in the business from quarter to quarter. Much like we’ve seen with Microsoft, as Amazon adds cloud and data center capacity, we should see that business re-accelerate in the coming quarters and margins improve. Boosting our confidence in that was the continued increase in backlog levels for AWS to $195 billion exiting June, which was up 25% year over year. We’d also note that there was a re-acceleration in backlog growth compared to 20% in the March quarter. Given the influence of AWS on Amazon’s overall profitability, that improvement should drive overall margin improvement in the coming quarters. Longer-term, the ongoing shift in enterprise spending in IT toward cloud from on-premise spending, which currently accounts for the bulk of IT spending, bodes well for AWS, especially as AI adoption accelerates. It’s also fair to say that Amazon’s margin potential is greater this time around as its near-term investment bears fruit. We can make that argument given ongoing cost reduction efforts, but also the growing influence of its high-margin advertising business, which generated $15.7 billion in revenue during Q2 2025, up just shy of 50% over the last two years. That faster rate of growth helps explain the improved margins at Amazon’s North American and International segments, as does the growing use of AI to drive productivity gains. So, while the market reacts to those developments and places AMZN shares in the “show me” box that Microsoft shares have emerged from, we’ll take the longer-term view and reiterate our $260 price target for AMZN shares. As the market digests the implications of Amazon’s earnings report and the shares settle out, we may get an even more compelling opportunity to add some additional shares.
July Monthly Price Change: 6.7%; Yield: 0.0%
INVESTMENT THESIS: We believe the upside will result from Amazon's continued eCommerce dominance, AWS's continued leadership in the public cloud space, and the ongoing growth of the company's advertising revenue stream, which feeds off Amazon's eCommerce business. Additionally, we think profitability will continue to improve as AWS and advertising account for a larger portion of total sales, as both these segments sport higher margins than the eCommerce operation. While we believe the increasing share of the revenue from these higher margin businesses will be key to driving profitability longer-term, we think margins on eCommerce stand to improve as the company's infrastructure is further built out and economies of scale further kick in. The embedded call option is that management is always looking to enter a new space and generate new revenue streams.
Target Price: Reiterate $260; Rating: One
Panic Point: $190
RISKS: High valuation exposes the stock to volatile swings, eCommerce has exposure to slower consumer spending and competition, management is not afraid to invest heavily, potential headwinds resulting from new eCommerce regulation in India, and management is not scared to invest aggressively for growth, which can at times cause volatile reactions as near-term concerns arise relating to the impact on margins.
Costco Wholesale COST; $939.64; 218 shares; 3.86%; Sector: Consumer Staples
UPDATE: After putting in a solid performance during H1 2025, shares of Costco COST turned lower in June, and that move lower continued in July. On June 30, we upgraded COST shares to a One rating given the likelihood the company would continue to grab consumer wallet share as consumers tap its warehouse offerings and the company continues to expand its footprint. We saw just that when we compared Costco’s June revenue report against the June Retail Sales report. That confirmation, along with the uptrend in grocery prices, led us to pick up some additional COST shares on July 24. To that lift in grocery prices, we can add a comment this week from Shake Shack that it sees beef prices up in the low-teens, one that brings an added pinch to consumers. We see that as a positive for Costco and its fresh food offering. As we move into the second half of 2025, the company’s high-margin membership fee revenue stream should see a more pronounced impact from its September 2024 price hike. The next-known catalyst for COST shares will be the company’s July sales results on August 6.
July Monthly Price Change: -5.1%; Yield: 0.5%
INVESTMENT THESIS: We like Costco's long-term prospects, driven by a club-based operating model that focuses on volumes, not margins, and therefore offers its customers a value proposition of everyday low prices. The strength of this model has created an incredibly loyal customer base with low churn and continued share gains in both brick-and-mortar and e-commerce. This is a global concept, evidenced by the strength of sales both in the U.S. and abroad, which includes an emerging China opportunity. We see the company's membership model as a key differentiator vs. other retailers, and its plans to open additional warehouse locations in the coming quarters should drive retail volumes and the higher-margin membership fee income as well. We also appreciate management's approach to capital returns and their willingness to return cash when it is in excess of the balance sheet.
Target Price: Reiterate $1,200; Rating: One
Panic Point: $925
RISKS: Inability to pass through higher costs, fuel prices, weaker consumer, and membership churn.
Eaton Corp. ETN; $384.72; 593 shares; 4.30%; Sector: Industrials
UPDATE: Shares of Eaton ETN were a robust performer for the Pro Portfolio in Q2 2025, and that outperformance continued in July with their almost 8% gain compared to the S&P 500’s 2.2% move higher. Leading the shares higher were continued data points about rising electricity demand and the increasingly robust outlook for AI and data center capital spending levels. Deloitte sees U.S. power sector investments reaching $1.4 trillion between 2025 and 2030. This six-year outlay is equivalent to the total capital expenditure of the U.S. power sector over the preceding 12 years, underscoring the challenge and the opportunity that lies ahead. A recent report from ICF projects significant increases in U.S. electricity demand over the next 25 years, with demand rising 25% by 2030 and 78% by 2050. In the near term, the U.S. Energy Information Administration (EIA) has raised its projections for electricity consumption in the country, citing a spike in power demand from commercial sectors — especially data centers — as a key driver. In its latest update of the Short-Term Energy Outlook (STEO), the EIA said it expects total U.S. electricity demand to rise from 4,097 billion kilowatt-hours (kWh) last year to 4,193bn kWh in 2025, and 4,283bn kWh in 2026. As we see the mix shift move toward AI data centers, we should see Eaton’s dollar per megawatt content rise, given greater power density, larger volumes of electrical equipment, but also greater cooling requirements. In our view, that is the driving story behind the opportunity in Eaton’s shares and one we aim to capture as shareholders. We recognize there will be some modest margin pressure, largely on the company’s Vehicle segment, due to tariffs, but we will continue to evaluate that as trade deals are announced. Heading into Eaton’s June-quarter earnings results on August 5, the shares are approaching our $400 price target. Based on the company’s updated outlook for H2 2025 and beyond, we will revisit our price target as well as the current One rating. With ETN shares accounting for 4.3% of the Pro Portfolio’s assets exiting July, should a post-earnings pop push the position past the 4.5% level, some prudent portfolio management may be called for.
July Monthly Price Change: 7.8%; Yield: 1.2%
INVESTMENT THESIS: Eaton is an intelligent power management company that makes products for data center, utilities, industrial, commercial, machine building, residential, aerospace, and mobility markets. That business is positioned to capitalize on the megatrends of electrification, energy transition, and digitalization. We see Eaton helping address the power pain point created by data center, EV charging infrastructure, and other drivers of electricity demand. Research estimates that data center power demand will grow 160% by 2030, accounting for 3%-4% of global power, up from 1%-2% today. Data centers will use 8% of U.S. power by 2030, compared with 3% in 2022.
Target Price: Reiterate $400; Rating: One
Panic Point: $325
RISKS: Raw material costs, labor costs, end market volatility, and government legislation.
Elastic N.V. ESTC; $83.70; 2,283 shares; 3.60%; Sector: Consumer Cyclical
UPDATE: Following Elastic’s ESTC July-quarter guidance, the shares have been largely rangebound through the end of July. We see the shares quietly building a nice base, with minor higher highs and higher lows, something we first called out in the June Monthly Roundup. That is technically a bullish trend, which we like to see. We can trace the root cause of that rangebound behavior to the company’s April-quarter earnings report, and to management’s overly conservative top-line forecast for the coming year. We characterize its guidance as such, given the continued expansion in its overall customer base, but notably for its Gen AI customers, and rising contract values that led to record remaining performance obligations and deferred revenue. Shortly thereafter, management admitted its guidance was likely overly cautious when it said, “Although we did not see macro impacts beyond the U.S. public sector in Q4, we extrapolated constraints that we saw in the U.S. public sector to potentially extend to our broader business. This is the largest factor affecting our revenue guidance range.” Despite that comment, consensus EPS expectations for Elastic’s July quarter have not budged in the last two months, even though we have seen pronounced evidence of AI adoption accelerating in the enterprise. Looking at the chart, it shows strong bullish indicators with money flow in positive territory, stochastics (momentum) still bullish, while the MACD is still on a buy signal. We do see some resistance at the $90 level, but if that is cleared, there is ample upside to go. The next known catalyst for ESTC shares is the company’s upcoming earnings report, which historically has been released in late August.
July Monthly Price Change: -0.7%; Yield: 0.0%
INVESTMENT THESIS: As digital transformation drives mission-critical business functions to the cloud, Elastic N.V. brings the Portfolio exposure to search AI adoption across IT and enterprise business lines as companies look to drive productivity. Elastic bills itself as the Search AI company and its Elastic Search AI Platform as a hosted, managed service across major cloud providers, including Amazon Web Services (AWS), Google Cloud, and Microsoft’s Azure in more than 55 public cloud regions globally. Customers can also deploy Elastic’s platform across hybrid clouds, public or private clouds, and multi-cloud environments. What we like even more about this is Elastic’s subscription-based business model, which accounts for just over 93% of its total revenue stream. This affords not only good visibility but also predictable cash flow and earnings. Moreover, the gross margins associated with the subscription business are above 80%, which helps explain the rising margin profile and EPS, as that business has come to account for a greater percentage of overall revenue. When it comes to potential risks, one sign that would lead us to reconsider owning the shares would be if either Elastic’s customer count or its subscription revenue per customer stalled. Another item we’ll be watching because of Elastic’s geographic mix, with 40% of its revenue outside of the U.S., is the dollar and its corresponding foreign exchange impact.
Target Price: Reiterate $120; Rating: One
Panic Point: $72
RISKS: Enterprise software spending, AI adoption, competitive dynamics, foreign exchange risk.
Marvell Technology MRVL; $80.37; 2,735 shares; 4.14%; Sector: Technology
UPDATE: Shares of Marvell MRVL continued to climb higher in July after notching an impressive Q2 2025 gain of more than 25%. We continue to see the company well-positioned to capitalize on strong AI and data center chip demand as well as the ramp in its custom AI silicon business. We also see rising AI adoption across the enterprise, with consumers and governments leading to a rebound in enterprise networking and carrier infrastructure. Keeping that bullish stance intact, Taiwan Semiconductor delivered a beat-and-raise June quarter. For the quarter, TSM’s High-Performance Computing (HPC) segment, which housed AI and data center markets, climbed to 60% of revenue compared to 52% in the year-ago quarter. Cutting those figures from a different angle, we find HPC revenue soared more than 65% on a year-over-year basis and just shy of 20% compared to Q1 2025. TSM guided current quarter revenue between $31.8 billion-$33.0 billion, up almost 38% on a year-over-year basis, and well ahead of the $30.7 billion consensus due to continued AI and data center strength. That outlook was reaffirmed by CapEx comments made by Alphabet, Microsoft, Meta, and Amazon, all of which continue to invest heavily as AI demand continues to outstrip capacity. Amazon also called out the continued ramp in its Trainium 2 AI chipset, one that is closely associated with Marvell. The company is tracking more than 50 additional opportunities in its pipeline, some of which are future versions of existing socket wins. During the presentation, Marvell specified that 12 of the 18 custom sockets are with four of the top U.S. hyperscalers, which can be inferred to mean Microsoft, Amazon, Meta, and Alphabet. Corning’s June-quarter results and comments for its Optical Communication segment, which posted a 41% year-over-year jump in sales for the quarter, illustrate the continued strength in AI and data center demand, but it also supports our thinking for a rebound in enterprise and carrier infrastructure spending. Those data points set up a favorable second half for Marvell, and we look forward to its updated outlook when it reports later this month. Ahead of that report, the next-known catalyst will be July revenue reports from TSM and Foxconn.
July Monthly Price Change: 3.8%; Yield: 0.3%
INVESTMENT THESIS: Marvell is a fabless supplier of high-performance standard and semi-custom infrastructure semiconductor solutions. These solutions power the data economy, enabling the data center, carrier infrastructure, enterprise networking, consumer, and automotive/industrial end markets. With roughly 75%-80% of Marvell's revenue stream tied to digital infrastructure, we see it continuing to benefit from rising content consumption and creation. Pointing to that rising demand that necessitates network densification and the build of digital infrastructure, Ericsson sees global monthly average usage per smartphone reach 46 gigabytes (GB) by the end of 2028 vs. 19 GB in 2023 and 15 GB in 2022.
Target Price: Reiterate $115; Rating: One
Panic Point: $60
RISKS: Technology risk, customer risk, competition risk, reliance on manufacturing partners, and supply chain constraints.
Nvidia Corp. NVDA; $177.87; 1,255 shares; 4.21%; Sector: Technology
UPDATE: Shares of Nvidia NVDA built on their impressive 45% move in Q2 2025, producing another low double-digit gain in July. That landed the shares in overbought territory, with an RSI reading over 70, but mid-month, we lifted our price target to $200 from $185 to reflect the pending return of AI chip shipments to China. Shortly thereafter, Taiwan Semiconductor delivered a beat-and-raise June quarter. For the quarter, TSM’s High-Performance Computing (HPC) segment, which housed AI and data center markets, climbed to 60% of revenue compared to 52% in the year-ago quarter. Cutting those figures from a different angle, we find HPC revenue soared more than 65% on a year-over-year basis and just shy of 20% compared to Q1 2025. TSM guided current quarter revenue between $31.8 billion-$33.0 billion, up almost 38% on a year-over-year basis, and well ahead of the $30.7 billion consensus due to continued AI and data center strength. That outlook was reaffirmed by CapEx comments made by Alphabet, Microsoft, Meta, and Amazon, all of which continue to invest heavily as AI demand continues to outstrip capacity. That is a very favorable backdrop for Nvidia, which will report its quarterly results on August 27. Ahead of that report, the next-known catalyst will be July revenue reports from TSM and Foxconn. We’ll also be tracking other hyperscaler capital spending comments. We continue to see NVDA well-positioned as AI adoption accelerates and the subsequent demand for AI factories keeps us not only bullish on the shares but wanting to remain owners of them.
July Monthly Price Change: 12.6%; Yield: 0.03%
INVESTMENT THESIS: Nvidia is well-positioned to benefit from ramping AI and data center spending. The company pioneered accelerated computing to help solve the most challenging computational problems. Nvidia is now a full-stack computing infrastructure company with data-center-scale offerings that are reshaping the industry. The company's full stack includes the foundational CUDA programming model that runs on all Nvidia GPUs, as well as hundreds of domain-specific software libraries, software development kits, or SDKs, and Application Programming Interfaces, or APIs. This deep and broad software stack accelerates the performance and eases the deployment of Nvidia accelerated computing for computationally intensive workloads such as artificial intelligence, model training and inference, data analytics, scientific computing, and 3D graphics, with vertical-specific optimizations to address industries ranging from healthcare and telecom to automotive and manufacturing. Nvidia reports in two business segments: Compute & Networking and Graphics. The Compute & Networking segment (78% of revenue, 85% of operating income) is comprised of Data Center accelerated computing platforms and end-to-end networking platforms, including Quantum for InfiniBand and Spectrum for Ethernet; NVIDIA DRIVE automated-driving platform and automotive development agreements; Jetson robotics and other embedded platforms; Nvidia AI Enterprise and other software; and DGX Cloud software and services. The Graphics segment (22% of revenue, 15% of operating income) includes GeForce GPUs for gaming and PCs, the GeForce NOW game streaming service and related infrastructure; Quadro/NVIDIA RTX GPUs for enterprise workstation graphics; virtual GPU, or vGPU, software for cloud-based visual and virtual computing; automotive platforms for infotainment systems; and Omniverse Enterprise software for building and operating metaverse and 3D internet applications.
Target Price: $200; Rating One
Panic Point: $130
RISKS: Market and interest rate risk, credit risk, country risk, and operational risk, including cybersecurity.
Qualcomm Inc. QCOM; $146.76; 1,220 shares; 3.37%; Sector: Technology
UPDATE: While Qualcomm QCOM shares lagged the market in Q2 2025, they were still a positive contributor to the Portfolio. That contribution continued through nearly all of July until the late-in-the-month post-June-quarter earnings report move lower in the shares erased those gains, leaving them in the red on a year-to-date basis. As we discussed in our analysis of the company’s better-than-expected June-quarter results that bested top and bottom-line expectations, the current quarter guidance only bookended the market consensus. In other words, not a beat-and-raise quarter, and that helps explain the pressure on the stock. In reviewing the report and what it showed for the company’s QCT chip business, we found it supportive of the business transformation away from smartphones. While others on Wall Street lowered their QCOM price targets closer to our $180 target, we reiterated our target and our One rating, given the continued diversification efforts that should bear more fruit over the next 18 months. Based on design wins, management confirmed Qualcomm remains on track to deliver $22 billion in combined automotive and IoT revenue by fiscal 2029. Part of that effort includes more than 100 AI PC designs being commercialized over the next 18 months. The move lower in QCOM after earnings provides us some room to scoop up more shares as they settle down in the coming days. We will be watching the shares against their 100-day moving average at $150.58, looking for a positive test of that support. If we get that, it would bring us one step closer to adding to our position.
July Monthly Price Change: -7.8%; Yield: 2.2%
INVESTMENT THESIS: Qualcomm focuses on foundational technologies for the wireless industry, including 3G (third generation), 4G (fourth generation), and 5G (fifth generation) wireless technologies and processor technologies, including high-performance, low-power computing, and on-device artificial intelligence technologies. As a connected processor company, its technology roadmap aims to enable the connected intelligent edge (the next generation of smart devices) across industries and applications beyond handsets, including automotive and the Internet of Things (IoT). Qualcomm has three reportable segments: QCT (Qualcomm CDMA Technologies) semiconductor business, which develops and supplies integrated circuits and system software based on 3G/4G/5G and other technologies for use in mobile devices; automotive systems for connectivity, digital cockpit, and ADAS/AD; and IoT including consumer electronic devices, industrial devices, and edge networking products. QCT accounts for 80%-85% of revenue. QTL (Qualcomm Technology Licensing) licensing business grants licenses or otherwise provides rights to use portions of the company's intellectual property portfolio, which includes certain patent rights essential to and/or useful in the manufacture and sale of certain wireless products. QTL accounts for ~15% of Qualcomm's revenue but contributes a greater portion of the company's operating income. Our focus on QCOM shares is revenue diversification as part of management's intended strategy to lessen its reliance on the smartphone market by tapping into the AI PC, IoT, and automotive chip markets. We see this unfolding over the next few years, which should lead Wall Street to revisit how it values the shares. It is that opportunity we aim to capture by owning the shares over the longer term.
Target Price: $180; Rating: One
Panic Point: $135
RISKS: Customer risk, technology advancement, competition risk, third-party supplier, and manufacturing partner risk.
ServiceNow NOW; $943.12; 193 shares; 3.43%; Sector: Technology
UPDATE: After rebounding mightily in the June quarter, shares of ServiceNow NOW struggled in July despite delivering quarterly results that simply crushed expectations and lifted subscription revenue expectations. Backing that thinking, we saw a nice uptick in current remaining performance obligations (RPO) to $10.92 billion compared to $8.78 billion in the year-ago quarter. To that, we can add the $13 billion in noncurrent RPO, up 29% year over year, which puts its total RPO at almost $24 billion. We see that offering ample coverage for management’s revised subscription revenue outlook of $12.775 billion-$12.795 billion for this year. That equates to about 9% stronger revenue in H2 2025 compared to H1 2025, and even stronger growth compared to H2 2024. During the earnings call, ServiceNow named-dropped several customer wins, this time for its AI platform, which included Exxon Mobil, Merck & Co., Banco do Nordestes Brasil, and the North Carolina Department of Transportation. Those wins and others led ServiceNow’s AI deal count to be up over 50% quarter on quarter. In the Signals that we’ve shared with you, it’s become clear that AI is a key focus in the enterprise. Viewed from a different angle, comments from Microsoft, Amazon, and others point to AI demand continuing to outstrip capacity. We continue to see ServiceNow very well positioned for that adoption and the positive impact on its subscription pricing, margins, and EPS. That combination led us to lift our NOW price target to $1,200 from $1,100. We rate NOW a One, and with the shares below our $950 pickup point, we are evaluating our next move, subject to market conditions.
July Monthly Price Change: -8.3%; Yield: 0.0%
INVESTMENT THESIS: The addition of ServiceNow adds exposure to the enterprise as it deploys AI-enabled solutions across its enterprise workflow platform. The company’s “Now Platform” is a cloud-based solution with embedded AI and machine learning (ML) capabilities that help unify and digitize workflows, driving productivity. At the heart of it, the company’s platform automates workflows across an entire enterprise by connecting disparate departments, systems, and silos in a seamless way to unlock productivity. ServiceNow counts more than 8,100 global customers, including 85% of the Fortune 500, with 97% of its revenue from subscriptions that have notched a 98% renewal rate. During the March 2025 quarter, ServiceNow also announced plans to acquire Moveworks, which offers front-end AI assistant and enterprise search technology, and Logik.ai, which provides AI-powered, and composable configure, price, and quote solutions for sales teams. We see these moves augmenting its offering and helping pave the way for further adoption of AI and subscription-based revenue.
Target Price: Reiterate $1,200; Rating: One
Panic Point: $825
RISKS: Industry and economic risk, competition and competitive pressures, and acquisition risk.
Universal Display OLED; $144.40; 1,388 shares; 3.78%; Sector: Technology
UPDATE: After rebounding sharply in May and June, shares of Universal Display OLED were a drag on the Portfolio in July despite the growing number of positive data points about organic light-emitting diode display adoption. We chalk that up to concerns over tariff-related pull-forward demand for the smartphone market as well as other consumer electronic devices. Despite that concern, Universal delivered a beat-and-lift June quarter with comments from Samsung, LG Display, Qualcomm, and others supporting stronger device volumes in H2 2025 and rising organic light-emitting diode display adoption levels. Longer-term, research firm Omdia continues to see higher organic light-emitting diode adoption ahead in smartphones, TV, and the automotive sector. That includes a wider array of foldable products, including Apple’s expected foldable iPhone next year. That backs many of the signals we’ve discussed with you in the first half of 2025 regarding design wins and other product announcements utilizing organic light-emitting diode displays. We’ve been patient with OLED shares through the first half of 2025, and the data points we’ve listened to are coming together very nicely. We will continue to play the long game with this position as organic light-emitting diode adoption continues to rise across a wider array of end markets. To be clear, we are talking quarters, not months, for this to play out. For now, we’ll keep our OLED price target at $200, but as we get more confirming data points for that display technology adoption, we intend to revisit it.
July Monthly Price Change: -6.5%; Yield: 1.2%
INVESTMENT THESIS: Universal Display focuses on the development and commercialization of organic light-emitting diode (OLED) technologies and materials for use in display and solid-state lighting applications. OLED displays are capturing a growing share of the display market, especially in the mobile phone, television, monitor, wearable, tablet, notebook, personal computer, augmented reality (AR), virtual reality (VR), and automotive markets. This adoption reflects advantages over competing display technologies concerning power efficiency, contrast ratio, viewing angle, video response time, form factor, and manufacturing cost. Universal Display's business strategy is to develop new OLED materials and sell existing and new materials to product manufacturers for display applications, such as mobile phones, televisions, monitors, wearables, tablets, portable media devices, notebook computers, personal computers, and automotive applications, and specialty and general lighting products. The company also looks to license its OLED material, device design, and manufacturing technologies to those manufacturers. As such, Universal Display has a significant portfolio of proprietary OLED technologies and materials with more than 5,500 patents issued and pending worldwide.
Target Price: Reiterate $200; Rating: One
Panic Point: $135
RISKS: Patent and Intellectual property protection; maintaining OLED manufacturing and customer relationships; technology risk; market risk.
Vulcan Materials Company VMC; $274.67; 613 shares; 3.17%; Sector: Building Materials
UPDATE: Building on their almost 12% move higher in Q2 2025, the shares of Vulcan Materials VMC notched a better-than-5% move in July, leaving them up almost 7% on a year-to-date basis. That move in July included the market looking past Vulcan’s weather-related miss when it reported its June-quarter results and focusing instead on adjusted EBITDA prospects in H2 2025. In our June Monthly Roundup, we discussed how weather-related issues in the quarter were a potential headwind for concrete and aggregate construction, and we would argue investors were expecting a modest miss for the quarter. That helps explain the trading range between $255-$275 we’ve seen in VMC shares since early May. Given the inclement weather experienced in H1 2025, we are likely to see H2 2025 account for a larger-than-usual piece of annual revenue as catch-up activity is augmented by new highway construction and other drivers of non-residential construction activity, including data center. As those volumes improve, we should see greater margin leverage associated with higher year-over-year gross profit per ton, driving adjusted EBITDA and EPS higher. Over the trailing 12 months, Vulcan’s ability to drive price lifted its gross margin to 31.5% compared to 29.7% over the preceding 12-month period. That combination of higher volumes and margins keeps us comfortable with Vulcan’s 2025 EBITDA guidance. With upside potential of about 15% to our current $310 price target, we have enough upside to maintain our One rating. As we collect construction data points for the current quarter, we’ll revisit that target and our rating as needed.
July Monthly Price Change: 5.3%; Yield: 0.8%
INVESTMENT THESIS: Vulcan Materials operates primarily in the U.S. and is the nation's largest supplier of construction aggregates (primarily crushed stone, sand, and gravel), a major producer of asphalt mix and ready-mixed concrete, and a supplier of construction paving services. Its products are the indispensable materials used in building homes, offices, places of worship, schools, hospitals, and factories, as well as vital infrastructure, including highways, bridges, roads, ports and harbors, water systems, campuses, dams, airports, and rail networks. Ramping spending associated with the Biden Infrastructure Law should drive demand for Vulcan's products over the coming years. Vulcan has historically complemented its organic growth prospects by acquiring businesses to expand its geographic reach and product scope. Since 2014, the company has acquired more than two dozen companies, including the 2021 acquisition of U.S. Concrete. That combination has allowed the company to deliver steady top and bottom-line growth over the last decade, with only a modest decline when the pandemic hit in 2020.
Target Price: Reiterate $310; Rating: One
Panic Point: $240
RISKS: General economic and business conditions; dependence on the construction industry; timing of federal, state, and local funding for infrastructure; changes in the level of spending for private residential and private nonresidential construction.
TWOS
Alphabet GOOGL; $191.90; 1,108 shares; 4.01%; Sector: Communication Services
UPDATE: July was a very strong month for Alphabet GOOGL shares, and their near 9% gain during the month made them a force within the Portfolio. The bulk of that move came after the company delivered impressive June-quarter results that pushed back on concerns over AI cannibalizing the company’s search and advertising business, and also led us to boosting our price target to $220 from $200. As we made that change, the technical setup in GOOGL shares led us to downgrade them to a Two rating. Continued gains at YouTube also contributed to the core Google Advertising revenue growing year over year, as did the subscription and device business. No surprise given the growing influence of YouTube that we’ve discussed with you in recent weeks. Google Cloud also continued to make gains for both its revenue contribution and its operating margin compared to the prior quarter and especially against the year-ago one. Granted, the 21% operating margin posted in the quarter for Google Cloud is well below the 43% of total Google Services revenue, but it’s come a long way over the last few quarters when its operating margin was sub-10%. We continue to see Google Cloud benefiting from enterprise cloud and AI adoption, especially as it integrates more AI agents into each of its cloud products. Per management, more than 85,000 enterprises, including LVMH, Salesforce, and Singapore's DBS Bank, now build with Gemini, driving a 35x growth in Gemini usage year-over-year. Impressive, but so is the cloud backlog figure of $106 billion discussed on the earnings call. That should allow for continued revenue growth even as the segment passed the $50 billion annual run rate figure in the June quarter. The technical condition remains strong, with higher highs and higher lows on the chart. That is our textbook definition of an uptrend. MACD is on a buy signal while the ADX shows a powerful trend in place. If market forces pull GOOGL shares closer to the 50-day moving average near $178, that could prompt us to revisit our current Two rating.
July Monthly Price Change: 8.9%; Yield: 0.5%
INVESTMENT THESIS: We believe that while search and digital ad dominance are what will carry the shares in the near-to mid-term, longer-term, it is the company's artificial intelligence "moat" that will provide for new avenues of growth. Exiting the March 2025 quarter, Alphabet reported over 270 million paid subscriptions across YouTube and Google One. YouTube Music and Premium alone reached 125 million subscribers globally. AI is what has made the company's search, video, and targeted ad capabilities best-in-class and is the driving force behind the company's success in voice (Google Home) and autonomous driving (Waymo). Furthermore, we believe it is this AI expertise that will also make the company more prevalent in other industries, including healthcare via its subsidiary Verily, as AI and machine learning continue to disrupt operations across industries. Exiting the March 2025 quarter, across all of its products, Alphabet had 0.5 billion users using its Gemini models. Adding to our positive view of the company's future opportunities, we believe that Alphabet's free cash flow generation and solid balance sheet set it apart and are what will allow the company to continue taking chances on far-out, ground-breaking, and potentially world-changing projects as well as fund capital returns to shareholders. We will continue to monitor advertising spend as well as the competitive landscape for the company’s core Search and Advertising business.
Target Price: Reiterate $220; Rating: Two
Panic Point: $155
RISKS: Regulatory risk (data privacy), competition, and macroeconomic slowdown impacting consumers and therefore ad buyer activity.
American Express AXP; $299.31; 595 shares; 3.36%; Sector: Financial Services
UPDATE: After grinding 19% higher in Q2 2025, shares of American Express AXP entered overbought territory, and that led us to lock in a slice of double-digit gains on July 7. Later in the month, Amex reported a beat and reiterated guidance that reaffirmed why we like its differentiated business model focused on card fee revenue and membership. During the June quarter, while Amex benefited from higher network volume spending, net fee card revenue grew at a much faster pace of 20% compared to the 7% gain in billed business. That 20% gain was driven by a combination of a 4% year-over-year increase in the total number of cards in force to $149.4 million and a 16% jump in average fee per card. That average fee increase reflects the continued shift to premium Amex cards, like Platinum. Those gains led net card fee revenue to account for 70% of Amex’s pre-tax income in H1 2025, up from 58% in H1 2024. Those figures explain the power of Amex’s membership business model and why we are very interested in the details surrounding the upcoming Platinum card refresh. We think the company’s outlook for H2 2025 could be conservative given trends in average fees per card, which should be nicely higher year over year in H2 2025. Spending has also held up better than expected, and as we know, consumer spending tends to be skewed to H2 2025 given multiple holidays. That led us to increase our AXP target to $340 from $310, and shortly thereafter, we picked up some additional AXP shares for the Portfolio near $308 on July 21. We will continue to monitor consumer spending, but the larger catalyst will be the Platinum card refresh later this year. In the meantime, the shares are likely to be supported by Amex’s share repurchase program, which, exiting June, had ~68 million shares left under its current authorization, roughly 10% of its outstanding shares.
July Monthly Price Change: -6.2%; Yield: 1.0%
INVESTMENT THESIS: American Express is a globally integrated, membership-driven payments company, providing customers with access to products, insights, and experiences that enrich lives and build business success. The company has four reportable operating segments: U.S. Consumer Services (USCS), Commercial Services (CS), International Card Services (ICS), and Global Merchant and Network Services (GMNS). American Express targets the premium consumer space by continuing to deliver membership benefits that span our customers’ everyday spending, borrowing, travel, and lifestyle needs, expanding its roster of business partners around the globe, and developing a range of experiences that attract high-spending customers. In 2024, the company’s net card fee revenue accounted for 65% of its pre-tax income, which we see providing a differentiated business model that should continue to grow as Amex wins new card members and drives its average fee per card higher.
Target Price: Reiterate $340; Rating: Two
Panic Point: $275
RISKS: Slowdown in consumer spending, competition, membership growth, merchant acceptance, lack of new product innovation.
Apple AAPL; $207.57; 825 shares; 3.23%; Sector: Technology
UPDATE: Shares of Apple AAPL moved higher in July, but still lagged the market during what is typically its seasonally weakest time of year. Restraining the shares were concerns over tariffs and potential pull forward in demand that could weigh on Q3 product revenue. Despite those market concerns, Apple delivered better-than-expected June-quarter results that benefited from stronger-than-expected iPhone and Services revenue. While we see incrementally stronger iPhone volumes ahead and continued gains in the higher-margin Service business in H2 2025, we kept our $235 price target and Two rating intact. During the June-quarter earnings call, Apple said that its iPhone 16 family grew double digits compared to the iPhone 15 in the year-ago quarter. That speaks to the power of the upgrade cycle as well as consumers shifting toward premium models with larger displays and higher price tags. While the iPhone install base is aging, staring down higher ASPs for the next-generation iPhone, our thinking is that folks will need a reason to upgrade. One of the levers to foster that will be progress on Apple Intelligence. Apple has released some AI features already, with more to come this year, but those tied to a more personalized Siri aren’t expected until next year. Apple telegraphed more AI investing ahead, which is not surprising, but, in our view, the company either needs to deliver before too long or contemplate using its balance sheet and M&A to catch up. Given the importance of that to iPhone and Apple’s other products, we suspect one or both of those moves could happen. An acquisition of Perplexity or another AI engine could be a nice catalyst for AAPL shares. While some may be inclined to throw in the towel, as we’ve said before, that upgrade cycle is the opportunity we see in the company’s earnings and Apple shares. In our view, it is worth sticking around while the higher-margin Services business becomes an even larger part of Apple’s mix, smoothing out Apple’s bottom line along the way. Near-term, however, with AAPL shares below key support levels, and knowing technical support can become technical resistance, we will want to sit on the sidelines. As we do that, given our Two rating and our price target, we’ll be mindful of upcoming July revenue results from Taiwan Semiconductor and Foxconn that could provide a catalyst for the shares should they bring another layer of confirmation for the seasonal smartphone market ramp.
July Monthly Price Change: 1.2%; Yield: 0.5%
INVESTMENT THESIS: While we acknowledge that near-to-midterm performance remains heavily influenced by iPhone sales, the dynamic is shifting as investors finally place greater emphasis on Services growth. We are bullish on the 5G upgrade cycle and believe longer-term upside will continue to come as Services revenue grows its share of overall sales. Services provide for a recurring revenue stream at higher margins, a factor that serves to reduce earnings volatility while allowing for a higher percentage of sales to fall to the bottom line; as a result, we believe that Services growth and the installed base, are much more important than how many devices the company can sell in each 90-day period. In addition to improved profitability, we also believe the transparent nature of this revenue stream will demand an expanded price-to-earnings multiple as segment sales grow. Furthermore, we believe that Apple's desire to push deeper into the healthcare arena will help make its devices invaluable as more life-changing features are added and the company works to democratize health records.
Target Price: Reiterate $235; Rating: Two
Panic Point: $180
RISKS: Slowdown in consumer spending, competition, lack of new product innovation, elongated replacement cycles, failure to execute on Services growth initiative.
Axon Enterprise AXON; $755.49; 246 shares; 3.50%; Sector: Aerospace & Defense
UPDATE: Looking back, the decision to re-arm the Portfolio with shares of Axon Enterprise AXON was a smart move back in February and March, considering the subsequent climb in the shares that made them a strong contributor during the first half of the year. In early July, however, we saw more than a little weakness emerge in the shares following comments from Byrna Technologies that it expects subdued consumer demand for its less-than-lethal self-defense products. As we pointed out in our Alert discussing the AXON weakness, the two companies are like apples and oranges — very different on multiple fronts. A few days later, we added some AXON shares near $743, and then again on July 24, we picked up even more for the Portfolio, at just over $698. AXON shares have since rebounded, and we see the company’s June-quarter earnings report on August 4 as the next catalyst for the shares. For us, the Axon story continues to be one centered on the mix shift toward the higher-margin, recurring revenue services business, as well as continued growth for its hardware business in federal, corporate, and international markets. In H2 2025, we should see AI take a larger role in driving that shift, and it should also foster further growth in several key metrics that we track for the company. During Q1 2025, the company’s annual recurring revenue grew 34% year over year to $1.1 billion, and exiting the quarter, its deferred revenue topped $1 billion, while its future contracted bookings rose to $9.9 billion compared to $7.0 billion exiting the year-ago quarter. While we expect the law of large numbers to take hold, should we see those metrics decline meaningfully in Axon’s June-quarter results, it would be a potential flag for us. We view that as a low probability given the number of signals that point to continued body camera and drone adoption in the public safety sector. We’ll also hope to learn more details about Axon’s big enterprise customer win early this year and how that may serve as a springboard into that market.
July Monthly Price Change: -8.8%; Yield: 0.0%
INVESTMENT THESIS: Axon Enterprise develops, manufactures, and sells conducted energy devices and cloud-based digital evidence management software designed for use by law enforcement, corrections, military forces, private security personnel, and private individuals for personal defense. The company operates in two segments: Taser (recently renamed Connected Devices) and Software & Sensors (recently renamed Software & Services). Taser develops and sells CEDs used for protecting users and virtual reality training. Software & Sensors manufactures fully integrated hardware and cloud-based software solutions such as body cameras, automated license plate reading, and digital evidence management systems. Axon delivers its products worldwide and gets most of its revenue from the United States. According to Mordor Intelligence, the wearable and body-worn cameras market on its own was valued at $1.62 billion in 2020 and is expected to reach $424.63 billion by 2026. Public safety organizations are increasingly adopting cloud solutions, leading to significant spending in this area. The digital spending in public safety is projected to reach $201 billion by 2027.
Target Price: Reiterate $840; Rating: Two
Panic Point: $650
RISKS: Manufacturing and supply chain, competitive factors, government regulation, technology change.
Bank of America Corp. BAC; $47.27; 4,410 shares; 3.93%; Sector: Financial Services
UPDATE: Bank of America BAC shares were little changed in July, which left them up more than 7.5% through the first seven months of the year, on par with the S&P 500. Following the outcome of the 2025 Fed stress tests and the increase in BofA’s quarterly dividend to $0.28 per share, we boosted our BAC price target to $55. Based on what we saw in the company’s earnings report and guidance, we saw no reason to change that target. We’d consider a rating revision from Two if the shares positively test support near the 50-day moving average, just below $45, but a much more compelling pick-up point would be near $42 to $43. Whether or not the shares find their way to such levels could be thwarted by BofA’s new $40 billion common stock repurchase program that went into effect on August 1. We would also reconsider our BAC price target as momentum in the M&A and IPO market continues to build, but we will be sure to check transaction details to determine which banking firms are involved in what deals. One other item we’ll be watching is the follow-through from the GENIUS Act and whether BofA does more than explore stablecoin initiatives.
July Monthly Price Change: -0.1%; Yield: 2.2%
INVESTMENT THESIS: Bank of America is one of the world's leading financial institutions, serving individual consumers, small and middle-market businesses, and large corporations with a full range of banking, investing, asset management, and other financial and risk management products and services. The company provides unmatched convenience in the United States, serving approximately 67 million consumer and small business clients with approximately 3,900 retail financial centers, approximately 16,000 ATMs, and award-winning digital banking with approximately 56 million verified digital users. Bank of America is a global leader in wealth management, corporate and investment banking, and trading across a broad range of asset classes, serving corporations, governments, institutions, and individuals around the world. Bank of America offers industry-leading support to approximately 3 million small business households through a suite of innovative, easy-to-use online products and services. The company serves clients through operations across the United States, its territories, and approximately 35 countries. From a reporting perspective, the company's business breaks down as follows: Net Interest Income breakdown: Consumer Banking 57%, Global Banking 23%, Global Wealth & Investment Management 14%, and Global Markets 6%; Income Before Tax breakdown: Consumer Banking 42%, Global Banking 27%, Global Wealth & Investment Management 16%, and Global Markets 15%. Bank of America pays a quarterly dividend of $0.26 per share, up from $0.18 a few years ago.
Target Price: $55; Rating: Two
Panic Point: $39
RISKS: Financial markets, fiscal, monetary, and regulatory policies, economic conditions, and credit ratings.
Dutch Bros BROS; $59.27; 2,925 shares; 3.27%; Sector: Consumer Cyclical
UPDATE: During the first five months of 2025, shares of Dutch Bros BROS climbed at a steady pace, making them a meaningful contributor to the Portfolio. While they ultimately closed Q2 2025 with a gain in the low double digits, BROS shares traded off in June. Part of that decline likely reflected the lack of company news during the month, as well as some short-term-minded folks taking profits. We don’t blame them; remember, we took some very profitable BROS chips off the table in late May. However, the shares continued to trend lower in July, and that led us to buy back the shares on July 24 at $59.27. We continue to favor the long game with BROS as the company continues to expand its footprint. Exiting the quarter, Dutch Bros had 1,012 locations, plans to add 130 more shops this year, and reiterated its target of 2,029 by 2029. For context, Starbucks had more than 17,000 locations across the United States, exiting the March quarter. That reaffirms our view that Dutch Bros has ample room to expand its footprint in the coming years without risking oversaturation, and the targeted food rollout for 2026 should be an added top-line driver. We expect a positive update on that strategy when the company reports its quarterly results on August 6. We have some room to add to further to our BROS position, and what we learn during the earnings call could give us a reason to do so.
July Monthly Price Change: -13.3%; Yield: 0.0%
INVESTMENT THESIS: Dutch Bros is an operator and franchisor of drive-thru shops that focus on serving high-quality, hand-crafted beverages with unparalleled speed and superior service. Coffee-based beverages make up ~50% of the menu mix, and ~25% of the menu mix is based upon the company’s proprietary Blue Rebel energy drink, which is highly customizable with flavors and modifiers and can be served blended or over ice. The energy platform helps unlock the afternoon daypart and broadens the company’s appeal. The remaining 25% of the menu mix is a wide variety of teas, lemonades, sodas, and smoothies. The company’s west-to-east expansion is a time-tested strategy that should drive revenue and EPS growth over the next several years. Leveraging that footprint expansion and low-single-digit comp sales growth, management reiterated its long-term guidance of around 20% annual revenue growth. Helping support that guidance, the company confirmed it will introduce an expanded food menu in 2026. Dutch Bros is slated to enter the consumer-packaged goods (CPG) space in a deal with Trilliant Food & Nutrition.
Target Price: Reiterate $85; Rating: Two
Panic Point: $50
RISKS: Commodity risks, labor costs, interest rate risk, and inflation.
First Trust Nasdaq Cybersecurity ETF CIBR; $72.69; 2,248 shares; 3.08%; Sector: Cybersecurity
UPDATE: Each time we note ripped-from-the-headlines confirmation points for the Pro Portfolio and its underlying strategy, one constant is the signals for cybersecurity demand. Artificial intelligence will super-charge familiar threats in 2025 and beyond, putting new wrinkles on old security challenges such as phishing, insider threats, and ransomware. Entering this year, research firm Gartner expected cybersecurity spending would rise $212 billion, but this week the firm increased that to $213 billion. It also forecasts cybersecurity spending accelerating in 2026 as it sees a concerted enterprise effort to shore up cloud security capabilities, particularly in relation to AI workloads. That upsized outlook, along with the post-earnings selloff in shares of Check Point Software following its "beat-and-reiterate" quarter, as well as the move lower in Palo Alto Networks after its formal takeover announcement of CyberArk Software, led us to pick up additional CIBR shares. As we made that move, we also upped our CIBR target to $85 from $78. We will still have ample room to expand the Pro Portfolio’s exposure to CIBR should we see a wider market pullback emerge. If such an event unfolded, CIBR shares near $69 would make for a wonderful addition, which also happens to be our established pick-up point. For now, our $63 panic point remains, but as CIBR shares move higher, we’ll lift that level in a commensurate manner. Catalysts we will be watching include subsequent M&A activity in the space as well as quarterly results and guidance from key CIBR holdings. That short list includes Broadcom, Cisco, Palo Alto Networks, CrowdStrike, Infosys, Cloudflare, CyberArk, Leidos, and Zscaler. Those top nine positions account for more than 57% of CIBR’s weighting.
July Monthly Price Change: -3.8%; Yield: 0.0%
INVESTMENT THESIS: The First Trust Nasdaq Cybersecurity ETF seeks investment results that correspond generally to the price and yield (before the fund's fees and expenses) of an equity index called the Nasdaq CTA Cybersecurity Index. The Nasdaq CTA Cybersecurity Index is designed to track the performance of companies engaged in the cybersecurity segment of the technology and industrial sectors. It includes companies primarily involved in the building, implementation, and management of security protocols applied to private and public networks, computers, and mobile devices to protect the integrity of data and network operations. To be included in the index, a security must be listed on an index-eligible global stock exchange and classified as a cybersecurity company as determined by the Consumer Technology Association. Each security must have a worldwide market capitalization of $250 million, have a minimum three-month average daily dollar trading volume of $1 million, and have a minimum free float of 20%.
Target Price: Reiterate $85; Rating: Two
Panic Point: $63
RISKS: Cybersecurity spending, technology, and product development, the timing of the product sales cycle, new products, and services in response to rapid technological changes and market developments, as well as evolving security threats.
Labcorp Holdings Inc. LH; $260.08; 710 shares; 3.48%; Sector: Healthcare
UPDATE: Despite the modest decline in Labcorp LH shares during July, the year-to-date price return generated by the shares for the first seven months of the year tallied 13.4%. That’s considerably greater than the analogous return for the S&P 500. We chalk that superior performance up to Labcorp continuing to execute on its strategy to integrate acquired businesses, expand its footprint, and reap the benefit of cost synergies, while also growing its diagnostics capabilities. While it may not be a sexy business or one that generates much in the way of headlines, the company remains a well-positioned play for our Aging of the Population investing theme. For its June quarter, Labcorp delivered a sizable bottom-line beat, reporting EPS of $4.35 compared to the $4.17 market forecast and $3.94 in the year-ago quarter. Exiting the June quarter, Labcorp’s trailing 12-month orders accelerated to $3.34 billion, up from $3.15 billion three months earlier, leaving its total backlog at $8.71 billion compared to $8.18 billion. That, along with some additional nip-and-tuck acquisitions completed in July, including acquiring select assets of the outreach business from Community Health Systems across 13 states, backs management's raised outlook for 2025. Management now sees its top line rising 7.5%-8.6% year over year, compared to 6.7%-8.0% at the end of March. That increase and continued margin improvement prospects led us to boost our LH price target to $300 from $265. A pullback near $255 would not only offer an attractive pickup point but also lead us to revisit our current rating.
July Monthly Price Change: -0.9%; Yield: 1.1%
INVESTMENT THESIS: Labcorp is a global leader in innovative and comprehensive laboratory services that provide vital information to help doctors, hospitals, pharmaceutical companies, researchers, and patients make clear and confident decisions. By leveraging its diagnostics and drug development capabilities, the company provides insights and accelerates innovations to improve health and improve lives. The company is organized under two segments, consisting of Diagnostics Laboratories (Dx), which includes routine testing and specialty/esoteric testing, and Biopharma Laboratory Services (BLS), consisting of Early Development Research Laboratories and Central Laboratory Services. Our attraction to LH shares stems from the combination of the aging population driving diagnostic testing growth and the increasing array of diagnostic testing as well. That combination is expected to drive the healthcare testing services market to $12.6 billion by 2029, from $7.4 billion in 2024, according to Markets and Markets. To augment its position in oncology, women's health, autoimmune diseases, and neurology, the company has been expanding through acquisitions and partnerships with health systems and regional, local labs.
Target Price: Reiterate $300; Rating: Two
Panic Point: $228
RISKS: Macroeconomic factors, changes in healthcare reimbursement models and products, government regulations, product discontinuations or recalls.
Meta Platforms META; $773.44; 283 shares; 4.12%; Sector: Communication Services
UPDATE: While Meta META shares got off to a slow start earlier this year, which allowed us to pick up more shares in April and early May, they were a champ even before their fantastic June-quarter results that confirmed several of our reasons for owning the name. In response to the quarter’s results and favorable prospects for both the core advertising revenue stream and AI-led margin improvement in the coming quarters, we lifted our META price target to $850 from $725. Because we are still in the early innings of Meta’s leveraging AI to drive pricing, productivity, and margins higher, which suggests more benefits to come in subsequent quarters, we will remain META owners to capture further gains. However, as we explained in our discussion of Meta’s June-quarter results, the post-earnings move vaulted their weighting to more than 4% of the Pro Portfolio’s assets. That means if we see the upward climb continue toward our new price target, past a certain point, we may opt to lock in some of the meaningful gains META has put in over the last several weeks. While the path to our $850 target offers additional 10% upside, that potential, along with the shares knocking on the door of overbought territory, means keeping our Two rating intact, at least for now. As you saw in April and May, given the longer-term opportunity tied to META, we are not averse to adding more shares when the risk-to-reward tradeoff is in our favor. As the shares settle out in the coming days, we’ll revisit potential pickup points as we lift our META panic point to $625 from $600. Granted, that’s a bit wider than usual, but we have seen some wide swings since February.
July Monthly Price Change: 4.8%; Yield: 0.3%
INVESTMENT THESIS: Meta segments its business between Family of App Products, which includes Facebook, Instagram, Messenger, Threads, and WhatsApp, and Reality Labs Products, which includes its metaverse and investments and future product R&D. Family of Apps accounts for ~99% of company revenue and 100% of company operating profit. Substantially all of Meta’s revenue is currently generated from advertising on Facebook and Instagram. Family daily active people (DAP) were 3.48 billion on average for the June 2025 quarter. Meta expects to spend $66 billion to $72 billion on capex in 2025, a significant increase year over year, with the majority of this spending focused on AI infrastructure and initiatives. Meta is positioned to benefit from the ongoing shift toward digital advertising and the adoption of AI across its product offerings. We recognize Meta is ramping up capital spending as part of the current AI arms race, but we see that as an investment that should drive productivity in its core advertising business. As the company harvests that investment, we could see a step up in margins, much like we saw in 2023.
Target Price: $850; Rating: Two
Panic Point: $625
RISKS: Ability to add and retain users and user engagement; marketing spend; new products or changes to existing ones; competitive risk, geopolitical risk.
Microsoft Corp. MSFT; $533.50; 370 shares; 3.72%; Sector: Technology
UPDATE: Microsoft MSFT shares soared in June, and combined with their performance in April and May, this brought their Q2 2025 gain to more than 30%. The shares continued to chug higher in July, and the pace of those gains accelerated following the company’s June-quarter results and guidance that knocked the cover off the ball. Going into that report on July 30, we were on record saying that, as Microsoft monetizes the cloud capacity it was adding, we would revisit our price target. The company delivered on that and then some as its Azure and other cloud growth re-accelerated in the June quarter to 39% on a year-over-year basis, topping management’s 34%-35% guidance back in April. Fueling that growth, for the first time, commercial bookings were over $100 billion in the quarter, up 37% year over year despite tough comparisons. Management commented that the number of $10 million-plus and $100 million-plus contracts was a big part of that increase and contributed to the company’s commercial remaining performance obligation (RPO) ballooning 35% to $368 billion. Quite impressive, but it was the comment made during the earnings call that roughly 35% of that RPO figure will be recognized as revenue in the next 12 months that really caught our attention. In response, we lifted our MSFT price target to $600 from $515. The continued move higher in MSFT shares left their RSI level at 81.74, closing out July, and heeding our discipline, we kept our MSFT rating at a Two. Remember, a Two rating isn't a "sell" rating, but one that indicates we would be buyers on a pullback in the shares. We’ll continue to evaluate entry and pickup levels for folks who are underweight the Portfolio’s MSFT position size, sharing them with you along the way. As we do that, we lifted our MSFT panic point to $450 from $410.
July Monthly Price Change: 7.3%; Yield: 0.7%
INVESTMENT THESIS: We believe the cloud to be a secular growth trend and that the upside to the shares will result from Microsoft's hybrid cloud leadership as the company grabs market share in this expanding industry. While companies may look to build out multi-cloud environments, Microsoft's Azure offering will be a prime choice thanks to its decision to provide the same "stack" used in the public cloud to companies for their on-premises data centers. Additionally, we would note that hybrid environments are currently the preference for most companies because they allow them to maintain critical data in-house while taking advantage of the agility and scalability provided by public clouds. Outside of the cloud opportunity, we maintain a positive view on the company's growing gaming business, which we believe is becoming an increasingly prominent factor in the Microsoft growth story as gaming becomes more mainstream, management works to convert its gaming revenue from one-time license purchase to a recurring subscription model and as technologies like augmented/virtual reality evolve. Finally, as it relates to LinkedIn and other subscription-based services such as O365 and various Dynamics products, we continue to value them highly for their recurring revenue streams, which, we remind members, provide for greater transparency of future earnings.
Target Price: $600; Rating: Two
Panic Point: $450
RISKS: Slowdown in IT spending, competition, cannibalization of on-premises business by the cloud.
Morgan Stanley MS; $14.46; 1,462 shares; 3.92%; Sector: Financial Services
UPDATE: In mid-May, we boosted our price target for Morgan Stanley MS to $140 from $120, and following the improving outlook for trading volumes and investment banking activity, we increased it again, to $145, on June 12. Coming into July, we lifted our MS price target to $150 following MS once again successfully passing the Fed’s latest round of stress tests and announcing an 8% increase to its quarterly dividend. That favorable backdrop set the stage for its June-quarter results, which included a favorable outlook for its investment banking and asset management businesses. With investment banking pipelines at Morgan Stanley and BofA being robust, we are inclined to remain owners of those shares to capture the incremental earnings leverage as that pipeline of IPO, M&A deals, and advisory assignments convert into transaction revenue and fees. Underscoring that conversion, Morgan Stanley is one of the advisors to Union Pacific in its $72 billion takeover of Norfolk Southern. As we see more deals come to market, we’ll revisit our MS price target as needed, but with a position size near 4% of the Portfolio’s assets, we’re not inclined to add more shares. For those whose position size is less than the Portfolio’s, we currently see a compelling risk-to-reward entry point near $127.
July Monthly Price Change: 1.1%; Yield: 2.6%
INVESTMENT THESIS: Morgan Stanley reports in three business segments: Institutional Securities (42% of trailing 12-month revenue, 38% of trailing 12-month Income Before Tax), Wealth Management (48%, 55%), and Investment Management (10%, 6%). While the IPO window has yet to reopen, the potential IPO class for 2025 continues to build with recent additions including Klarna and StubHub. That would be a boon to private equity firms and others that have been nursing IPO candidates during the dark period and a positive for Morgan Stanley's investment banking business. Expected deregulation under the Trump administration is a potential catalyst for Morgan's M&A business. Meanwhile, folks continuing to be behind in retirement savings bodes well for Morgan Stanley's wealth management business in the coming quarters, while continued market volatility bodes well for its equity trading business.
Target Price: $150; Rating: Two
Panic Point: $120
RISKS: Market and interest rate risk, credit risk, country risk, and operational risk, including cybersecurity.
Palantir Technologies PLTR; $158.35; 822 shares; 2.45%; Sector: Financial Services
UPDATE: Palantir PLTR shares continued to climb at a brisk pace in July, rising another 16% on top of the more than 60% move they registered in Q2 2025. While the shares were not overbought exiting July, the cumulative move of more than 125% since their April low sets a high bar for Palantir’s June-quarter earnings report after the market close on Monday, August 4. As we see it, the fundamental reason for owning PLTR is to capture the benefits of the company’s expanding and diversifying customer base, as well as AI adoption to drive productivity. Management’s latest guidance calls for revenue to climb 14% in the second half of 2025 compared to the first half of the year. Also, adjusted operating income is expected to grow at a quicker 16% or higher rate. That means we should see stronger free cash flow in the second half of 2025, as well as margins bounce back. But again, given the move in PLTR shares over the last four months, expectations will be high for what Palantir delivers next week, both for its June quarter and updated H2 2025 outlook. With a beta of 2.59, we could see a strong reaction in PLTR, and that could give us an opportunity to pick up some additional shares down the line. We will also use the company’s updated outlook to revisit our price target, which we have raised multiple times since starting our position in the shares at $79.11 on March 11.
July Monthly Price Change: 16.2%; Yield: 0.0%
INVESTMENT THESIS: Palantir Technologies specializes in big data analytics and builds software platforms that help organizations integrate, analyze, and make sense of vast amounts of data for both commercial and government clients. While much has been made about the company’s exposure to the federal government, its software is used across 90 industries, and the larger global government sector accounted for 55% of revenue last year. The balance was from the commercial sector. While those percentages matched the ones for 2023, Palantir’s customer count jumped to 711 by the end of 2024 from 497 at the end of 2023, nearly double compared to the end of 2023. For 2024, the average revenue across its top 20 customers was $64.6 million, up from $54.6 million in 2023 and $49.4 million in 2022. Commercial remaining deal value (RDV) stood at $1.79 billion exiting 2024, up 49% sequentially and 99% on a year-over-year basis. That equates to about 47% of the expected 2025 revenue. We will continue to monitor Palantir’s RDV and deferred revenue metrics, but in our view, key items to watch will be the continued diversification of its customer base across industries and increasing revenue per customer. Because we are still in the relatively early innings of AI adoption, we are inclined to be long-term owners of PLTR shares. Exiting 2024, Palantir had just over $935 million remaining under its current share repurchase program.
Target Price: $160; Rating: Two
Panic Point: $115
RISKS: Economic and IT budget spending risk, technology risk, competition and competitive pressures, and customer acquisition risk.
SuRo Capital SSSS; $8.49; 13,700 shares; 2.19%; Sector: Financial Services
UPDATE: Following the more than 20% move higher in June, shares of SuRo Capital SSSS continued to chug higher in July. The catalyst for that move higher was two-fold. First, SuRo management issued a preliminary update on its investment portfolio for the second quarter, and expectations for its net asset value to be between $9-$9.25 per share at the end of June. That jump from $6.66 exiting the March-ending quarter reflects the upswing in stock prices for CoreWeave and ServiceTitan, as well as appreciation in other SuRo positions, including Open AI. In response, we bumped our SSSS price target to $9.25 from $8.75. The second catalyst was the return of SuRo’s dividend stream as it monetizes its investment portfolio. The company declared a dividend of $0.25 per share that was paid on July 31 and should be reflected across the Portfolio’s 13,700 position in its cash position. Given the company’s BDC structure, we see more dividends ahead as it continues to monetize its investment portfolio. For that reason, we will view our position in SSSS on a total return basis. We will continue to monitor the IPO market as well as potential filings from other SuRo investments. During July, SuRo’s Chairman and CEO, Mark Klein, joined us on the Stocks & Markets podcast, and you can listen to that conversation here.
July Monthly Price Change: 3.4%; Yield: 3.1%
INVESTMENT THESIS: SuRo Capital is a business development company (BDC) that invests in high-growth, venture-backed private companies. As SuRo monetizes those portfolio investments through either IPO or M&A transactions, it must pay out most of its earnings to shareholders in the form of dividends. What’s important to factor into our thinking is that SuRo’s strategy isn’t to hold public company investments but rather to monetize them following the lock-up expiration. Sometimes this can be immediate, and sometimes it can be in stages, but when that monetization occurs, it triggers dividend payments. And because a BDC has to pay out at least 90% of its taxable income through dividends to shareholders, there is the possibility of a special dividend to hit that qualifying threshold late in the year. As we think about this, it means that we should focus on total return with SSSS, which is defined as capital gains in the shares plus dividends received while owning them. What this means is even if we see SSSS shares trade sideways or move lower, depending on the size of the dividend payments in the coming quarters, the position’s total return could still be sizable for the Pro Portfolio. SuRo portfolio holdings at the end of March included CoreWeave (CRWV), ServiceTitan (TTAN), OpenAI, Liquid Death, Whoop, and fintech company Plaid, as well as roughly 30 other holdings.
Target Price: $9.25; Rating: Two
Panic Point: $7
RISKS: Industry and economic risk, competition and competitive pressures, and acquisition risk.
TJX Companies TJX; $124.53; 687 shares; 1.36%; Sector: Financial Services
UPDATE: We called up TJX Companies TJX to the Portfolio on July 1, taking advantage of a recent pullback in the shares and the company's position with consumers looking to maximize their shopping dollars. For 2025, TJX is expected to deliver EPS of $4.50, up around 5.5% year over year, but we are interested in capturing the EPS acceleration in the second half of this year, which is expected to grow 33% compared to the first half. Coresight Research estimates around 15,000 stores are expected to close in the U.S., up from 7,325 last year, and that plays into one of TJX’s key strengths. For context, that 15,000 figure would be the highest number of store closures seen since 2020. On July 21, we added some additional TJX shares to our coffers at $122.49, a move that modestly improved the position’s overall cost basis. We made that move following data from consulting firm McKinsey & Co. that reaffirmed consumers are cutting back on their spending and switching to lower-priced products. Higher grocery bills are another reason consumers are poised to tap TJX’s businesses, and we see that demand picture improving amid the Back-to-School shopping season and before too long, the holiday shopping season. We have ample room to grow the Portfolio’s position in TJX shares and will do so prudently.
July Monthly Price Change: -0.6%; Yield: 1.4%
INVESTMENT THESIS: The TJX Companies is the leading off-price apparel and home fashions retailer in the United States and worldwide. It has over 5,000 stores and six branded e-commerce sites that offer a rapidly changing assortment of quality, fashionable, brand-name, and designer merchandise at prices generally 20% to 60% below full-price retailers’ regular prices on comparable merchandise. The company operates in four segments: Marmaxx and HomeGoods, both in the US, TJX Canada, and TJX International. TJX looks to capitalize on opportunities to acquire merchandise at substantial discounts that regularly arise from the production and flow of inventory in the apparel and home fashions marketplace. These opportunities include, among others, closeouts from brands, manufacturers, and other retailers; special production direct from brands and factories; order cancellations and manufacturer overruns. We see that positioning TJX extremely well, as consumers feel the pinch of ongoing inflation pressures and their efforts to stretch the disposable spending dollars they do have, including tapping discounted shopping locations.
Target Price: $137; Rating: Two
Panic Point: $115
RISKS: Operational, strategic buying, and competitive risks, as well as consumer spending patterns.
United Rentals URI; $882.94; 235 shares; 3.91%; Sector: Industrials
UPDATE: Since bottoming in early April, shares of United Rentals URI have been a steady and strong performer for the Pro Portfolio, rising at a pace nearly double the S&P 500 in the June quarter. That strength continued in July, leading the shares to eclipse our price target and become overbought, forcing us to make a prudent move to lock in a massive triple-digit gain by trimming back the Portfolio’s exposure. As we made that move, we also downgraded URI shares to a Two rating from One. After United’s June quarter earnings report, we increased our price target to $950, a move we widely acknowledged was overdue. However, given the upside from the then-current share price as well as the relative strength index level at that time, we reiterated our "Two" rating. We would be open to revisiting that rating should either URI shares drift lower toward $800 or if upcoming nonresidential construction spending data accelerates considerably compared to the first five months of 2025. The June construction spending report is set to be published on Friday, Aug. 1, and we will also factor H2 2025 outlooks from construction-related companies, such as Caterpillar, Tudor Perini, and Jacobs Solutions. We continue to see United benefiting from the construction of new data centers, as well as infrastructure programs and other drivers of non-residential construction, which keeps us bullish on URI shares.
July Monthly Price Change: 17.2%; Yield: 1.0%
INVESTMENT THESIS: United Rentals, the largest equipment rental company in the world, operates throughout the United States and Canada, and has a limited presence in Europe, Australia, and New Zealand. It serves industrial and other non-construction, commercial (or private non-residential) construction, and residential construction. Industrial and other non-construction rentals represented approximately 50% of rental revenue, primarily reflecting rentals to manufacturers, energy companies, chemical companies, paper mills, railroads, shipbuilders, utilities, retailers, and infrastructure entities; commercial construction rentals represented approximately 46% of rental revenue, primarily reflecting rentals related to the construction and remodeling of facilities for office space, lodging, healthcare, entertainment, and other commercial purposes; and residential rentals around 4% of revenue. We see the company benefiting on three fronts — the seasonal uptick in construction spending, the release of funds and projects associated with the five-year Biden Infrastructure bill, and the company's nip-and-tuck acquisition strategy that should further enhance its geographic footprint.
Target Price: Reiterate $950; Rating: Two
Panic Point: $680
RISKS: Industry and economic risk, competition and competitive pressures, and acquisition risk.
Waste Management WM; $229.16; 620 shares; 2.68%; Sector: Industrials
UPDATE: Shares of Waste Management WM were a drag on the Pro Portfolio in Q2 2025 and were little changed in July. However, what we saw in the company’s June-quarter earnings report and the outlook for further margin improvement led us to bump our WM price target to $255 from $245. Near-term, those prospects will be driven by pricing actions taken in the core waste removal business and further automation across its residential fleet. Management also sees quicker progress integrating WM Healthcare Solutions (the former Stericycle business) and now sees realized synergies toward the upper end of its $80 million-$100 million target for this year. That should help bolster overall EBITDA margins, which came in at almost 30%. As the digestion of WM Healthcare Solutions continues, Waste still targets other nip-and-tuck acquisitions in the fragmented sanitation market. During the June-quarter earnings call, the group commented on a robust pipeline with expected acquisition spending topping $500 million this year. While that is a modest amount relative to WM's 2025 revenue guidance of $24.275 billion-$25.475 billion, the longer-term play with these acquisitions is to bring their margins up to WM's levels, allowing the company to capture the incremental profit. While we do not build acquisitions into our expectations, as new ones are announced and subsequently integrated, we’ll reflect that in our WM price target. Alongside increasing our WM price target, we also reset our pickup point at $227, and we are watching that level closely. We would not mind adding more shares of this seasoned operator, a move that would also boost the Portfolio’s dividend income.
July Monthly Price Change: 0.1%; Yield: 1.4%
INVESTMENT THESIS: 2025 will see more nonresidential construction activity because of the Biden Infrastructure Law, but now we can finally factor in activity for the CHIPs Act, which saw its first award this week. Other potential drivers include spending associated with the Inflation Reduction Act, including the much-awaited start of building out a nationwide network of EV charging stations. Alongside that bright outlook for WM's commercial business, automation efforts and pricing power in its sticky residential business should drive margins and EPS generation higher in the coming quarters. Given the fragmented nature of the North American waste and recycling industry, we see ample room for Waste Management to grow its footprint via nip and tuck acquisitions. As it does that, management’s track record of integrating acquired businesses and wringing out costs bodes well for further profit growth. We are in the early days of WM Healthcare Solutions, but we see the business growing as management integrates and cross-sells against its core business and flexes the ability to integrate nip-and-tuck acquisitions as it has at the core waste business. Here, too, we see room to consolidate a fragmented industry, which makes this a natural for Waste Management.
Target Price: $255; Rating: Two
Panic Point: $215
RISKS: Industry and economic risk, competition and competitive pressures, and acquisition risk.
