January Monthly Roundup: Stocks Slide Into February as Volatility Spikes
During the month we locked in hefty gains, trimmed back a few positions and closing out another.
You've reached your free article limit
You've read 0 of 1 free Pro articles.
Coming into the new year, we shared our thinking that as the S&P 500 flirted with fresh highs, the December-quarter earnings season and corresponding guidance for 2026 would be a key determinant for the market’s vector and velocity. As part of that, we also believed that companies would need to deliver beat-and-raise quarters, not just in-line ones, to move higher lest they come under pressure. We also expressed our concern that the market would likely remain volatile, in part due to earnings, but also because of developments out of Washington, more specifically, the White House.
Those observations have matched what we've seen play out in the market through January, as the only indicator that moved steadily higher week over week was the Volatility Index. All in, the VIX climbed more than 13%, putting it at its highest Friday closing level since late November. When we trace back developments that transpired over the month, it’s easy to see why:
- Trump and Venezuela, Iran, Greenland, and, more recently, Canada
- Concerns over the “AI bubble” and corresponding capital spending, but at the same time, worries about AI pressuring software company revenues
- ICE and Minneapolis
- Another potential government shutdown
- Big layoffs announced by Amazon (AMZN) , United Parcel Service (UPS) , Citigroup (C) , Pinterest (PINS) , Autodesk (ADSK) , and others.
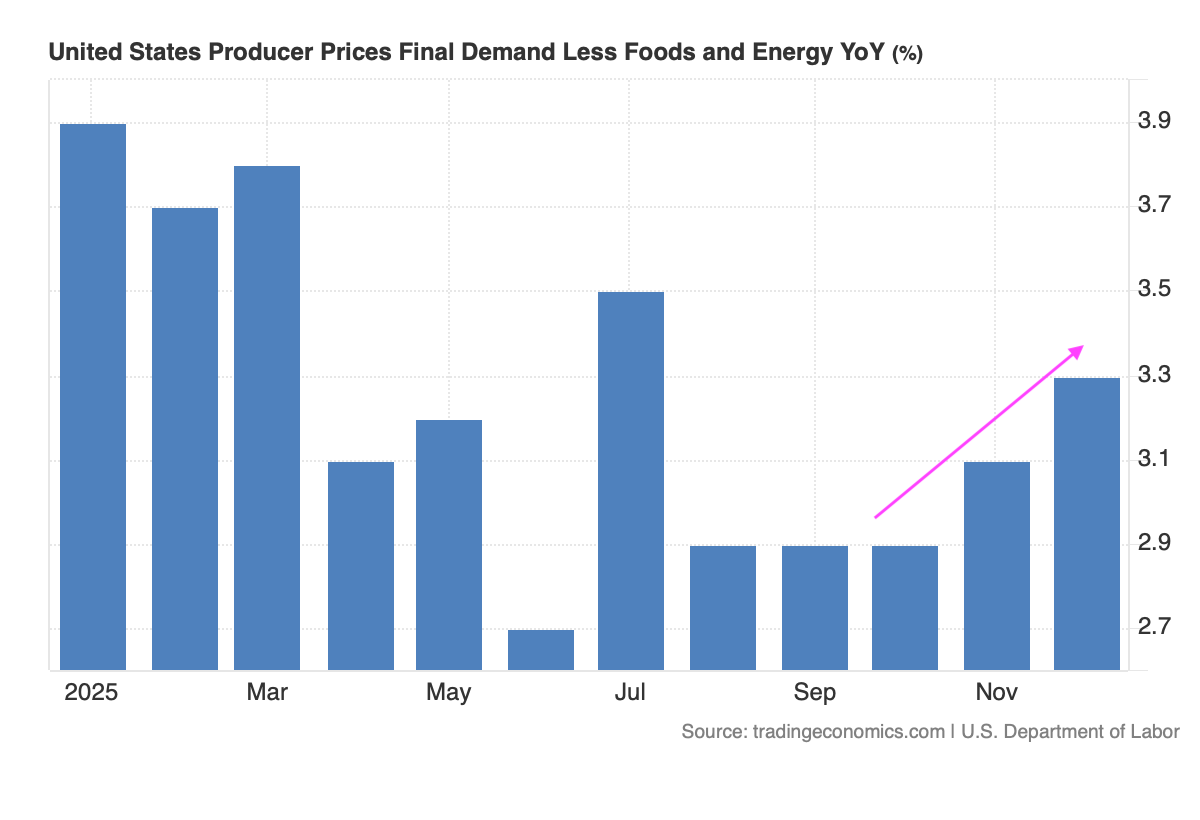
- December core PPI and S&P Global’s January Flash PMI pointing to inflation pressures perking back up, raising renewed questions about potential 2026 Fed rate cuts.
Those are just some of the developments, and while we can add the current earnings season, it’s fair to say we may have missed some others. The point is that the total of those events has raised anxiety in the market, and that is leading to not only extreme moves in the market but individual stocks as well. Arguably, when we see moves like those that fly in the face of data points and other metrics, it tells us expectations were likely too high, and emotion is driving the market, at least in the short-term.
The very wise Charlie Munger has some thought on situations like this:
“You need to keep raw irrational emotion under control. You need patience and discipline and an ability to take losses and adversity without going crazy.”
That's not easy to do, especially this past month, but we do our best given our responsibilities to the Pro Portfolio and to you. We recognize that times like this can be more than frustrating for folks, especially when reactions are sharp and, in many cases, very much overdone.
Rather than react in the moment, we tend to slow things down, take a breath, and re-test our investment thesis against the new data that has surfaced. If things have changed, as in the case of Qualcomm (QCOM) , we’ll act accordingly. But if we see key metrics that drive a company’s business moving in the right direction or doing so at a brisk pace, we’re inclined to be patient in the face of short-term market price fluctuations.
Remember, we’re investors, not “reactors,” and that means we are inclined to use mismatches between fundamentals, key data points, and stock prices to our long-term advantage. If this sounds a bit like the time tested quote from Warren Buffett, “Be fearful when others are greedy and greedy when others are fearful,”, we’re inclined to agree. The issue is that it sounds all good when you say it out loud, but in practice, it can be a little stomach-wrenching, especially for newer investors.
The December-quarter earnings season continues over the next few weeks, and the start of February brings with it data that will start to reveal the speed of the economy in the current quarter. After a sloppy finish to January, we have a few positions, such as ServiceNow (NOW) , Palantir (PLTR) , Axon (AXON) , and Dutch Bros (BROS) , back in an oversold condition, and one or two, such as Microsoft (MSFT) , near that. Tempting, but given what we know is ahead of us as we begin the second month of trading in 2026, let’s proceed carefully and keep our focus on the long-term.
Enjoy your weekend, stay warm, and we’ll see you back here, bright and early on Monday.
Catching Up on the Portfolio in January
Out of the gate, the Portfolio had a strong start to January, led higher by the likes of Amazon (AMZN) , Axon (AXON) , American Express (AXP) , Alphabet (GOOGL) , Eaton (ETN) , United Rentals (URI) , Welltower (WELL) , and Costco’s (COST) considerable rebound. The start of the December-quarter earnings season also lent a helping hand with the corresponding move higher in shares of Morgan Stanley (MS) and Bank of America (BAC) . As we moved deeper into the earnings season, once again modest misses led to company shares getting punished even if forward guidance was better than expected and other sweeteners were announced, like a dividend increase or an upsized stock repurchase program.
Despite favorable or robust improvement for key metrics like RPOs that speak to the contrary, renewed concerns over Gen AI and software as a service weighed considerably on shares of ServiceNow (NOW) , Palantir (PLTR) , and Axon. Combined with the late-month selloff in gold and silver, which erased some but not all of the January gain for our EPS Diplomats basket, the Portfolio had a challenging start to 2026.
We made a few moves with the Portfolio during the final week in January. This included picking up additional shares of SuRo Capital (SSSS) on January 26, and Welltower (WELL) on January 27. We also did some prudent yet profitable trimming with Costco shares on the 27th. And before Waste Management (WM) reports its December-quarter results, we made a similar move on January 28.
Earlier in the month, we bowed to our portfolio discipline and cleaved off a slice of Bank of America shares with an enviable gain of 100%. In mid-January, we closed out our position in Qualcomm (QCOM) , given concerns over the impact on smartphone and PC shipments in the first half of 2026 from higher memory prices and shifted capacity to the AI and data center markets. While we didn’t top tick the sale, we still walked away with a respectable 21% gain on that position, after which we put Qualcomm in the Bullpen for potential reconsideration mid-year.
We put some of that returned capital to work in shares of ServiceNow on January 16, and roughly a week later, we picked up more shares of Broadcom (AVGO) and Palantir on January 22.
As we turn our gaze toward February, we’ll mark the calendar for upcoming dividend payments from American Express on February 10 and ones from Costco and Morgan Stanley on February 13.
This Week's Portfolio Videos
We cover a lot of ground during the week in our Daily Rundowns. If you happened to miss one or more of them, here are some helpful links:
Monday, January 26: Our Positioning After CoreWeave's Big Move
Tuesday, January 27: Bracing for the Big 'Slug' of Tech Earnings
Wednesday, January 28: Stocks & Markets Podcast: Silver, Gold, Oil, King Dollar, and Small-Caps
This Month’s Podcasts and Signals
Big discussions and insights are had during TheStreet Stocks & Markets Podcast, and in Signals, we share the latest news for the Pro Portfolio’s strategies. Here are some quick links to those conversations conducted over the last several weeks:
January 7: Stocks & Markets Podcast: Peter Tchir on Geopolitics, Power Prices and ProSec
January 10: Consumers Are Spent, France Hack, U.S. of Old and More Investing News
January 13: Stocks & Markets Podcast: S&P Indicators, Fed Moves, and Portfolio Strategy With Bob Lang
January 15: Stocks & Markets Podcast - Why Portfolio Construction Matters With Louis Llanes
January 17: Robo (Translation) Cops; Rich Pay Later, Too; More Investing News
January 24: Sober Savings, Prices Still Too High, Tariffs Hit Hard, More Investing News
January 28: Stocks & Markets Podcast: Silver, Gold, Oil, King Dollar, and Small-Caps
Some helpful links if you prefer to catch the podcast on the go, in the car, or wherever. Be sure to give it a like or thumbs up and leave a review if you’re so inclined. We’d appreciate it.
YouTube, Apple Podcasts, Spotify
Key Global Economic Readings
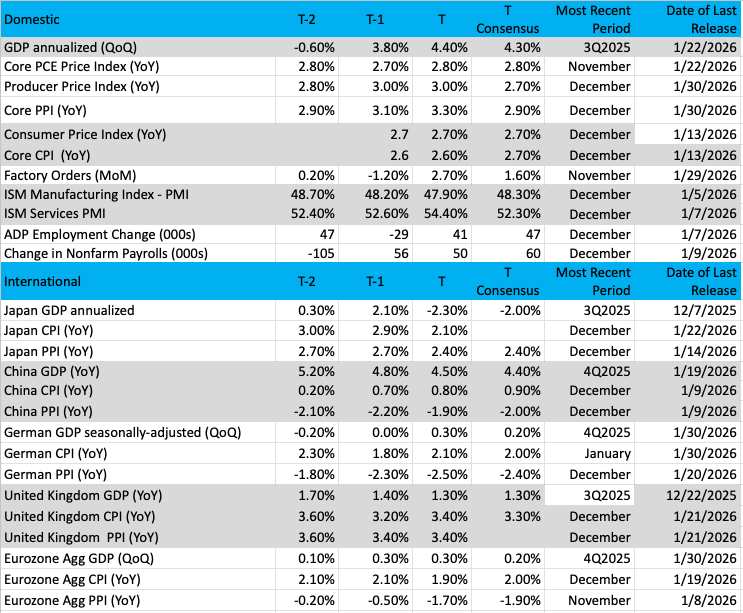
(Note: T is the most recent period, T-1 is the prior period's reading, and T-2 is two periods back, the intent being to illustrate any trends.)
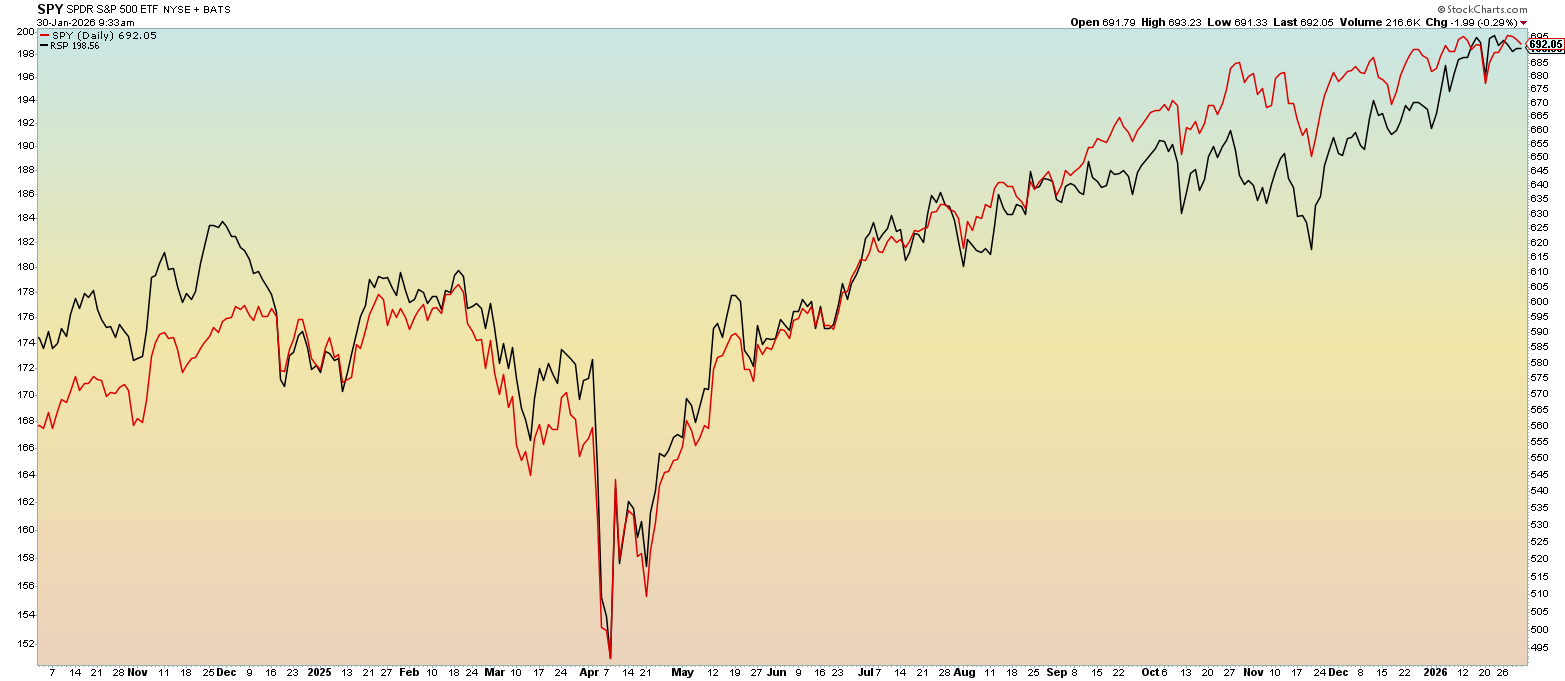
Chart of the Week: S&P 500 – Equal Cap vs. Market Cap Weighted
Today, we will review the State Street SPDR S&P 500 ETF Trust (SPY) vs. the Invesco S&P 500 Equal Weight ETF (RSP) , or the weighted average S&P 500 against the equal-weighted index. To review the difference, the RSP ETF weights each member of the index equally, basically one vote based on membership. No company has more influence over the RSP than any other, and when the RSP is strong, it means more groups/sectors are participating in the market movement.
On the other hand, the SPY is cap-weighted. The most valuable companies in the index have the strongest influence on the movement in SPY, and we often see names such as Nvidia (NVDA) , Apple (AAPL) , and Google (GOOGL) help push the SPY higher even if other members struggle to keep up.
We like to compare how the SPY and RSP move, often in sync but not always. Currently, we see a slight bit of divergence, but both ETFs are near all-time highs. The recent moves from the fall were both strongly correlated, but the SPY did slightly outperform the RSP. A clue here, when the Russell 2000 is strong, as it is now, it means we could expect the RSP to also perform better than the SPY.
Earnings season has a big influence on these two ETFs. Once earnings season has passed and the biggest names have reported, look for other factors like economic growth, interest rates, geopolitics, and monetary issues to be influential on movements in the RSP and SPY, more than normal.
Other charts we shared with you this past week were:
Monday, January 26: Nasdaq 100 (NDX) - Divergences May Have Negative Consequences
Monday, January 26: Meta (META) - It's 'Put Up or Shut Up' for Meta
Tuesday, January 27: Welltower (WELL) - Will This Holding Get 'Well' Soon?
Wednesday, January 28: Nvidia (NVDA) - Is AI Already Priced In for Nvidia Investors?
Thursday, January 29: Waste Management (WM) - On a Roll — And AI Has Nothing to Do With It
The Week Ahead
Moving into the second month of 2026, we will have another wave of quarterly results and four Pro Portfolio companies reporting. Unlike this past week, we will also have a smattering of fresh economic data to parse through, including multiple looks at the services sector, inflation, and job creation in January. Following the Fed’s policy meeting this past week, the CME FedWatch Tool is unchanged, and by that we mean the market does not expect another rate cut until the Fed concludes its June policy meeting.
Of course, with Fed Chair Powell stepping down on May 15, President Trump’s announced successor, former Fed Governor Kevin Warsh, will take over. Whether or not Warsh will be able to persuade the FOMC to deliver the more aggressive rate cuts Trump is vocal about is to be determined.
Per Powell, if the Fed starts to see inflation come down, the central bank will be in a better place for the central bank to become more dovish with policy. This is where we remind you that the Fed’s preferred inflation metric, core PCE, ticked higher in November to 2.8%. The next reading for that indicator, on February 20, will be for December. Between now and then, we’ll get several other looks at inflation. What we saw with the December core PPI figure didn’t exactly support President Trump’s comment at Davos that inflation was licked.
And while Powell’s comment midweek was on inflation, we will continue to track developments on the employment front. We’ve seen the recent layoff announcements from Amazon, UPS, Pinterest, Autodesk, Meta, and others. This will lead us to closely follow upcoming Challenger Job Cuts reports and corporate management team comments in the coming weeks. Interestingly, during its quarterly earnings call this week, ADP shared that it continues to see
… continuing reductions in the level of overall layoffs going on in the job market… areas that potentially you may think of as being more subject to being at risk with AI, we're not actually seeing it in those industry verticals. So, things like financial services, things like professional services, tech, and so on, we're actually seeing reasonably healthy growth.
That would indicate a steadier, but potentially still slow jobs market. With indications that enterprise adoption and usage of AI is on the rise, we’ll revisit ADP’s comments in coming quarterly calls.
Here's a closer look at the economic data coming at us next week:
U.S.
Monday, February 2
S&P Global Manufacturing PMI – January (9:45 AM ET)
ISM Manufacturing Index – January (10:00 AM ET)
Construction Spending – December (10:00 AM ET)
Tuesday, February 3
JOLTs Job Openings & Quits – December (10:00 AM ET)
Wednesday, February 4
MBA Mortgage Applications Index – Weekly (7:00 AM ET)
ADP Employment Change Report – January (8:15 AM ET)
S&P Global Services PMI Report (Final) – January (9:45 AM ET)
ISM Non-Manufacturing PMI Report – January (10:00 AM ET)
EIA Crude Oil Inventories – Weekly (10:30 AM ET)
Thursday, February 5
Challenger Job Cuts Report – January (7:30 AM ET)
Initial & Continuing Jobless Claims – Weekly (8:30 AM ET)
EIA Natural Gas Inventories – Weekly (10:30 AM ET)
Friday, February 6
Employment Report – January (8:30 AM ET)
University of Michigan Consumer Sentiment Index (Prelim) – January (10:00 AM ET)
Consumer Credit – December (3 PM ET)
International
Monday, February 2
China: RatingDog Manufacturing PMI - January
Wednesday, February 4
Japan: S&P Global Service PMI – January
China: RatingDog Services PMI – January
Eurozone: HCOB Services PMI – January
UK: S&P Global Services PMI – January
Eurozone: Inflation Rate - January
Thursday, February 5
Germany: Factory Orders – December
Eurozone: Retail Sales – December
UK: Bank of England Interest Rate Decision
Eurozone: European Central Bank Interest Rate Decision
Friday, February 6
Japan: Leading Economic Index (Prelim) – December
Germany: Industrial Production - December
As you'll see below, we have a more manageable pace of earnings reports from our holdings for the week ahead. Unlike the barn burner that was the second half of this past week, we’ll use the extra time to connect more dots across other company results and shed perspective on what we hear from the ones we own.
We will be doing just that with hyperscaler capital spending levels for 2026. This week, we learned Meta (META) was stepping up those plans significantly, but we won’t have a more complete picture until we hear from Amazon (AMZN) and Alphabet (GOOGL) .
Looking out a bit further, here are the reporting dates for others in the Portfolio that have shared them:
February 10 – Welltower (WELL)
February 12 – Arista Networks (ANET) , Dutch Bros (BROS)
February 17 – Labcorp (LH)
February 25 – Nvidia (NVDA)
March 5 – Costco (COST)
When Axon (AXON) , Broadcom (AVGO) , Marvell (MRVL) , SuRo Capital (SSSS) , and TJX (TJX) announce their reporting dates, we’ll be sure to share them with you.
Here's a closer look at the earnings reports coming at us next week:
Monday, February 2
Open: Tyson Foods (TSN), Walt Disney (DIS)
Close: NXP Semiconductor (NXPI), Palantir Technologies (PLTR)
Tuesday, February 3
Open: ADM (ADM), Capri Holdings (CPRI), Eaton (ETN) , Ferrari (RACE), Grainger (GWW), Illinois Tool Works (ITW), Merck (MRK), PayPal (PYPL), PepsiCo (PEP)
Close: AMD (AMD), Chipotle (CMG), Cirrus Logic (CRUS), Clorox (CLX), Lumentum (LITE), Mondelez International (MDLZ), Skyworks (SWKS), Take-Two (TTWO)
Wednesday, February 4
Open: Eli Lilly (ELI), GE Healthcare (GEHC), Kennametal (KMT), New York Times (NYT), Stanley Black & Decker (SWK), Uber (UBER), Yum China (YUMC), Yum! Brands (YUM)
Close: Alphabet (GOOGL) , Coherent (COHR), elf Beauty (ELF), Omega Health (OHI), Qualcomm (QCOM), SiTime (SITM), Snap (SNAP)
Thursday, February 5
Open: AGCO (AGCO), Bristol-Myers (BMY), Construction Partners (ROAD), Cummins (CMI), Estee Lauder (EL), Hershey Foods (HSY), Ralph Lauren (RL), Tapestry (TPR)
Close: Affirm (AFRM), Amazon (AMZN) , Coty (COTY), Digital Realty Trust (DLR), Fortinet (FTNT), Synaptics (SYNA), USA Rare Earth (USAR)
Friday, February 6
Open: AutoNation (AN), Carlyle Group (CG), Newell Brands (NEWL), Under Armour (UAA).
Portfolio Investor Resource Guide
· Economic Data: Here's a List of Links to the Key Economic Data We Closely Watch
· Investing Terminology: 16 Key Terms Club Members Should Know
· 10-Ks: Want to Know About a Stock? Read the Company's Reports
· 10-Qs: Unlock the Numbers and Key Information Behind Your Stock With the 10-Q
· Income Statement: Our Cheat Sheet to Understanding This Financial Document
· Balance Sheet, Cash Flow Statements, and Dividends: How to Know If a Company Is Off-Kilter? Read Its Balance Sheet
· Valuation Metrics: Everyone Wants a Value. Here's How Investors Can Find
· Thematic Investing 101 Webinar
· Like the Benefits of ETFs? Let’s Talk About Models
The Portfolio Ratings System
1 - Buy Now (BN): Stocks that look compelling to buy right now.
2 - Stockpile (SP): Positions we would add to on pullbacks or a successful test of technical support levels.
3 - Holding Pattern (HP): Stocks we are holding as we wait for a fresh catalyst to make our next move.
4 - Sell (S): Positions we intend to exit.
ONES
Amazon AMZN; $239.30; 881 shares; 3.91%; Sector: Consumer Discretionary
UPDATE: After climbing just over 5% in Q4 2025, shares of Amazon (AMZN) rose by more than 3% in January. We can trace some of that move to holiday shopping data and monthly retail sales that show consumers continued to lean into digital shopping, one leg of our thesis in owning Amazon shares. We also saw numerous signs of consumers embracing AI as part of not only their holiday shopping efforts, but increasingly, day-to-day digital shopping. That meshes well with Amazon’s Rufus efforts. Growing enterprise adoption of AI also bodes well for Amazon Web Services (AWS), as does the company’s intent on growing the high-margin advertising business, in part by leveraging Prime and its digital shopping platform. This week, Amazon not only shared plans to cut its headcount by another 16,000 as it focuses on productivity improvement, in part by leveraging AI, but also that it is resetting part of its grocery strategy. As investors, we think both moves make sense and bode well for margins and digital shopping revenue, respectively. When Amazon reports its December-quarter results next week, items that will garner close attention will be AWS growth metrics, but we will be looking for continued margin gains across all of its reporting segments. Capital spending plans for 2026 will also be a hot topic, but the question we’ll be interested in learning the answer to is when Amazon will see a pick-up in revenue and margins as capacity additions are made. Outside of the company’s core businesses, per recent 13F-HR filings, Amazon holds a stake of 158.36 million shares in Rivian, 225,428 shares in Marvell, as well as positions in other companies. In mid-December, Amazon was reportedly in talks with OpenAI for an investment of around $10 billion, a move that would likely include OpenAI using AWS and Amazon’s Trainium chips, a positive for our Marvell and Broadcom shares. This week, it was reported that Amazon is pursuing a far larger investment in OpenAI. We will be following that closely, given reports that OpenAI is pursuing a Q4 2026 IPO. We’ll also monitor developments for Amazon’s autonomous vehicle effort, known as Zoox.
January Price Change: 3.7%; Yield: 0.00%
INVESTMENT THESIS: We believe that upside will result from Amazon's continued e-commerce dominance, AWS's continued leadership in the public cloud space, and the ongoing growth of the company's advertising revenue stream, which feeds off Amazon's e-commerce business. Additionally, we think profitability will continue to improve as AWS and advertising account for a larger portion of total sales, as both these segments sport higher margins than the eCommerce operation. While we believe the increasing share of the revenue from these higher-margin businesses will be key to driving profitability longer-term, we think margins on eCommerce stand to improve as the company's infrastructure is further built out and economies of scale further kick in. The embedded call option is that management is always looking to enter a new space and generate new revenue streams.
Target Price: Reiterate $310; Rating: One
Panic Point: $210
RISKS: High valuation exposes the stock to volatile swings, e-commerce has exposure to slower consumer spending and competition, potential headwinds resulting from new e-commerce regulation in India, and management is not scared to invest aggressively for growth, which can at times cause volatile reactions as near-term concerns arise relating to the impact on margins.
Arista Networks ANET; $141.89; 1,325 shares; 3.50%; Sector: Technology
UPDATE: While Arista Networks (ANET) had a rocky start to 2026 during the first half of January, the shares rebounded in the second half of the month, leading them to finish the month up by almost 10%. We did not add any shares in December or January, but we did build up the Portfolio’s position in November, a move that also improved our cost basis. We continue to think AI adoption and usage across the enterprise, consumers, and government entities will drive network capacity higher, as will the use of AI agents and AI-generated video. To paraphrase January comments from Taiwan Semiconductor, we see this as a megatrend. As those adoption and usage rates rise, ensuing capacity issues should foster additional capital spending on networks and digital infrastructure. We aim to capture that, as well as the AI and data center buildout, by being shareholders in Arista. When the company reports its December-quarter results, we will be closely tracking developments for its deferred revenue, which rose to $4.7 billion exiting the September quarter, from $4.1 billion in the prior one. Given the AI and data center announcements made during the quarter from hyperscalers and others, a flat deferred revenue figure for Q3 2025 would be disappointing. Catalysts that could lead us to raise our price target include stronger-than-expected AI and data-center capital spending efforts from key Arista customers, Microsoft and Meta, as well as others in the AI and data-center space. Arista will report its quarterly results on February 12.
January Price Change: 8.3%; Yield: 0.00%
INVESTMENT THESIS: Arista Networks engages in the development, marketing, and sale of data-driven, client-to-cloud networking solutions for AI, data center, campus, and routing environments in the Americas, Europe, the Middle East, Africa, and the Asia-Pacific. Its cloud networking solutions consist of Extensible Operating System (EOS), a publish-subscribe state-sharing networking operating system offered in combination with a set of network applications. The company offers data center, cloud, and AI networking, cognitive adjacencies, and cognitive network software and services. It also provides post-contract customer support services, such as technical support, hardware repair, and replacement parts beyond standard warranty, bug fixes, patches, and upgrade services. The company serves a range of industries comprising internet companies, cloud service providers, financial services organizations, government agencies, media and entertainment, healthcare, oil and gas, education, manufacturing, industrial, and others. Two of Arista’s largest customers in the last few years are two Portfolio holdings you’ll quickly recognize — Microsoft and Meta. Per Arista’s 10-K filings, both Meta and Microsoft each account for more than 10% of revenue. Other named customers include Amazon’s AWS, Google Cloud, Anthropic, Canva, SAP, Shopify, Apple, Oracle, Bank of America, and Accenture.
Target Price: $180; Rating: One
Panic Point: $110
RISKS: Economic, customer, supply chain, and competition risks.
Axon Enterprise AXON; $483.58; 377 shares; 3.38%; Sector: Aerospace & Defense
UPDATE: Shares of Axon (AXON) started 2026 with a bang, rising more than 7% through most of January. We attribute that to continued wins with public safety, federal, and commercial applications for its hardware and software services. However, despite no company-specific news or warnings from competitors like Motorola Solutions, AXON shares crumbled the last few days of January, leaving them down nearly 15% for the month and once again in oversold territory. A potential explanation is the spillover of concern for software as a service that hit software stocks this week, but that misses what is driving AXON shares and, in our view, offers another bite at the Axon apple. For us, the Axon story continues to be centered on the mix shift toward the higher-margin, recurring revenue services business, as well as continued growth for its hardware business in federal, corporate, and international markets. The global public safety and security market is expected to grow from an estimated $581.9 billion in 2025 to approximately $1.63 trillion by 2034, led by technology and software segments. Per Deloitte, AI adoption in public safety is rapidly accelerating, shifting from experimental pilot programs to integrated, daily operations designed to improve efficiency and resource allocation. A first responder survey conducted by Lexipol found that 40% of agencies surveyed are starting to use AI or are researching the use of AI, 12% use AI on a daily basis, and 6% “rely on” AI during emergency-response operations. What stood out to us was the 40-percentage-point year over year increase in the 71% figure that reflects 22% of respondents describing AI as “a top priority” in the future of public safety, and 49% called AI “important” to public safety. Those findings support our bullish stance on Axon shares and will have us sizing up annual recurring revenue and future contracted bookings figures when Axon reports its December-quarter results. Exiting the September quarter, those figures stood at $1.3 billion and $11.4 billion compared to Axon’s 2025 revenue guidance of ~$2.74 billion. With the end of the government shutdown in November, we are likely to see catch-up spending benefit Axon. We also see Axon well-positioned to capitalize on that multi-year tailwind, which is augmented by the police shortage pain point.
January Price Change: -14.9%; Yield: 0.00%
INVESTMENT THESIS: Axon Enterprise develops, manufactures, and sells conducted energy devices and cloud-based digital evidence management software designed for use by law enforcement, corrections, military forces, private security personnel, and private individuals for personal defense. The company operates in two segments: Taser (recently renamed Connected Devices) and Software & Sensors (recently renamed Software & Services). Taser develops and sells CEDs used for protecting users and virtual reality training. Software & Sensors manufactures fully integrated hardware and cloud-based software solutions such as body cameras, automated license plate reading, and digital evidence management systems. Axon delivers its products worldwide and gets most of its revenue from the United States. According to Mordor Intelligence, the wearable and body-worn cameras market on its own was valued at $1.62 billion in 2020 and is expected to reach $424.63 billion by 2026. Public safety organizations are increasingly adopting cloud solutions, leading to significant spending in this area. The digital spending in public safety is projected to reach $201 billion by 2027.
Target Price: Reiterate $800; Rating: One
Panic Point: $520
RISKS: Manufacturing and supply chain, competitive factors, government regulation, and technology change.
First Trust Nasdaq Cybersecurity ETF CIBR; $69.06; 2,730 shares; 3.50%; Sector: Cybersecurity
UPDATE: After retreating in November and December, we picked up more shares of the First Trust Nasdaq Cybersecurity ETF (CIBR) on January 14. For the first month of 2026, CIBR shares moved lower along with tech and software stocks, but we see more gains ahead, especially as AI adoption by bad actors will serve to accelerate existing attack types and result in new ones. That leads us to think cybersecurity spending will remain on an upward trajectory. We’re not alone in that thinking. Cybersecurity Ventures predicts that global spending on cybersecurity products and services will exceed $520 billion annually by 2026, up from $260 billion in 2021. Also like us, Cybersecurity Ventures sees cybersecurity and cybercrime prevention as a growth industry. The research firm sees the imperative to protect increasingly digitized businesses, governments, schools, Internet of Things devices, and industrial control systems (ICS), as well as semiconductors, medical devices, gaming systems, cars, ships, planes, drones, trains, ATMs, and consumers from cybercrime propelling global spending on cybersecurity products and services to $1 trillion annually by 2031. That double-digit compound annual growth rate keeps us bullish on cybersecurity spending and the diverse exposure captured by owning CIBR shares. As we move further into the December-quarter earnings season, we’ll be reviewing company comments about cybersecurity spending and updating our CIBR price target as needed.
January Price Change: -3.3%; Yield: 0.42%
INVESTMENT THESIS: The First Trust Nasdaq Cybersecurity ETF seeks investment results that correspond generally to the price and yield (before the fund's fees and expenses) of an equity index called the Nasdaq CTA Cybersecurity Index. The Nasdaq CTA Cybersecurity Index is designed to track the performance of companies engaged in the cybersecurity segment of the technology and industrial sectors. It includes companies primarily involved in the building, implementation, and management of security protocols applied to private and public networks, computers, and mobile devices to protect the integrity of data and network operations. To be included in the index, a security must be listed on an index-eligible global stock exchange and classified as a cybersecurity company as determined by the Consumer Technology Association. Each security must have a worldwide market capitalization of $250 million, have a minimum three-month average daily dollar trading volume of $1 million, and have a minimum free float of 20%.
Target Price: Reiterate $85; Rating: One
Panic Point: $68
RISKS: Cybersecurity spending, technology and product development, the timing of the product sales cycle, new products, and services in response to rapid technological changes and market developments, as well as evolving security threats.
Costco Wholesale COST; $940.25; 215 shares; 3.76%; Sector: Consumer Staples
UPDATE: After expressing our frustration with Costco (COST) shares over the last few months in 2025, our patience paid off following the company’s monthly comp sales figures. After bottoming just before the Christmas holiday, COST shares soared double digits, spurred on by the impressive, adjusted December comp sales figure of 6.2% with 6.3% in the U.S. Clearly, Costco continued to take consumer wallet share, but let’s remember that December figure, as well as recent ones, are standing on the shoulders of similar figures 12 months ago. The continued January melt-up in COST shares expanded their position size and moved them into an overbought condition, which led us to take some very profitable chips off the table on January 27. As we explained in that alert, because we continue to see persistent inflation pressures impacting consumers as well as consumer stockpiling ahead of winter storm Fern benefiting Costco’s forthcoming January sales report, we will retain a sizable position in the stock. After that trade, the shares gave back some of their earlier January gains, but still finished the month up more than 8%. Costco’s January sales report will be out on February 4, and as we should we start to see a meaningful decline in its adjusted comp sales figures, we may need to revisit the role of COST shares in the Portfolio. With that January report in hand, we will revisit our price target and our current One rating.
January Price Change: 9.0%; Yield: 0.60%
INVESTMENT THESIS: We like Costco's long-term prospects, driven by a club-based operating model that focuses on volumes, not margins, and therefore offers its customers a value proposition of everyday low prices. The strength of this model has created an incredibly loyal customer base with low churn and continued share gains in both brick-and-mortar and e-commerce. This is a global concept, evidenced by the strength of sales both in the U.S. and abroad, which includes an emerging China opportunity. We see the company's membership model as a key differentiator versus other retailers, and its plans to open additional warehouse locations in the coming quarters should drive retail volumes and the higher-margin membership fee income as well. We also appreciate management's approach to capital returns and their willingness to return cash.
Target Price: Reiterate $1,100; Rating: One
Panic Point: $825
RISKS: Inability to pass through higher costs, fuel prices, weaker consumer, and membership churn.
Eaton Corp. ETN; $351.51; 593 shares; 3.87%; Sector: Industrials
UPDATE: Following a challenging Q4 2025, shares of Eaton (ETN) started 2026 on a stronger footing, rising close to 10% in January. The rebound in the shares follows the continued stream of headlines and articles about the looming electricity capacity shortfall, which is a powerful tailwind for the bulk of Eaton’s revenue and profits. Deloitte sees U.S. power sector investments reaching $1.4 trillion between 2025 and 2030. This six-year outlay is equivalent to the total capital expenditure of the U.S. power sector over the preceding 12 years, underscoring the challenge and the opportunity that lies ahead. The ICF projects significant increases in U.S. electricity demand over the next 25 years, with demand rising 25% by 2030 and 78% by 2050. In the near term, the U.S. Energy Information Administration (EIA) has raised its projections for electricity consumption in the country, citing a spike in power demand from commercial sectors — especially data centers — as a key driver. In late January, the company announced it would spin off its lower-margin and more cyclical Vehicle and eMobility businesses in 2027. The remaining Eaton will derive 83% of its revenue from electrification and the balance from Aerospace. The outlook for Eaton’s Aerospace business also looks bright, given the record backlog at Boeing. The next set of catalysts for ETN shares will be aggregate hyperscaler capital spending levels for 2026, updated electric utility capital spending plans, and Eaton’s earnings report on February 3. When Eaton reports its December-quarter results, we’ll be tracking relevant backlog figures, but we’ll also be interested in what is said about the 2025 Boyd Thermal acquisition and how that should bolster its data center positioning.
January Price Change: 10.4%; Yield: 1.31%
INVESTMENT THESIS: Eaton is an intelligent power management company that makes products for data center, utilities, industrial, commercial, machine building, residential, aerospace, and mobility markets. That business is positioned to capitalize on the mega trends of electrification, energy transition, and digitalization. We see Eaton helping address the power pain point created by data center, EV charging infrastructure, and other drivers of electricity demand. Research estimates that data center power demand will grow 160% by 2030, accounting for 3% to 4% of global power, up from 1% to 2% today. Data centers will use 8% of U.S. power by 2030, compared with 3% in 2022.
Target Price: Reiterate $420; Rating: One
Panic Point: $325
RISKS: Raw material costs, labor costs, end market volatility, and government legislation.
Marvell Technology MRVL; $78.92; 2,145 shares; 3.15%; Sector: Technology
UPDATE: Shares of Marvell Technology finished January down mid-single digits despite a good number of data points that back our investment thesis. We continue to see Marvell benefiting from multiple tailwinds, including AI and data-center spending, its ramping custom AI silicon business, and an accelerating rebound in its enterprise networking and carrier infrastructure business as AI adoption and usage rates climb further. Looking to the company’s fiscal 2027, which ends in January 2027, Marvell’s initial guidance calls for Data Center segment revenue to grow by more than 25% and the Communications & Other revenue to be up 10%. Some back-of-the-napkin math implies around $10 billion in revenue during fiscal 2027, compared to the $5.8 billion delivered in fiscal 2025. Fueling that expected increase is the quickly growing interconnect business, which should grow faster than overall cloud capital spending next year, and the continued ramp in Marvell’s custom AI silicon business, which on its own should be up ~20% in fiscal 2027. Marvell signaled that, based on its program wins, it already sees its Data Center revenue growth accelerating above fiscal 2027’s 25% growth target. For a company that typically guides one quarter at a time, Marvell is sharing far more than usual, an indication that suggests its program visibility has improved. In late 2025, Marvell announced its acquisition of Celestial AI, the creator of Photonic Fabric, an optical interconnect technology platform for AI computing systems that is expected to accelerate Marvell’s connectivity strategy for next-generation AI and cloud data centers. Based on Celestial's current customer line-up and program wins, Marvell said it sees meaningful revenue contributions from Celestial AI beginning in the second half of fiscal 2028, reaching a $500 million annualized run rate in the fourth quarter of fiscal 2028, doubling to a $1 billion run rate by the fourth quarter of fiscal 2029. Giving support to Marvell’s multi-year outlook, in late January, Microsoft trotted out its second-generation AI chip, Maia 200. Two others were Taiwan Semiconductor’s robust outlook for AI and data center chips, and the more aggressive than expected increase in capital spending levels at Meta for infrastructure and AI. Next week, we have quarterly results from Amazon and Alphabet, and what they say about custom AI chip plans and capital spending levels will be of interest for Marvell and our other chip holdings. Shortly thereafter, the next set of potential catalysts will be January revenue reports from TSM and Foxconn.
January Price Change: -7.1%; Yield: 0.28%
INVESTMENT THESIS: Marvell is a fabless supplier of high-performance standard and semi-custom infrastructure semiconductor solutions. These solutions power the data economy, enabling the data center, carrier infrastructure, enterprise networking, consumer, and automotive/industrial end markets. With roughly 75% to 80% of Marvell's revenue stream tied to digital infrastructure, we see it continuing to benefit from rising content consumption and creation. Pointing to that rising demand that necessitates network densification and the build of digital infrastructure, Ericsson sees global monthly average usage per smartphone reach 46 gigabytes (GB) by the end of 2028, versus 19 GB in 2023 and 15 GB in 2022.
Target Price: Reiterate $140; Rating: One
Panic Point: $75
RISKS: Technology risk, customer risk, competition risk, reliance on manufacturing partners, and supply chain constraints.
Meta Platforms META; $716.50; 337 shares; 4.48%; Sector: Communication Services
UPDATE: After drifting lower in Q4 2025 with more of the same in the first few weeks of January, shares of Meta META popped following the company’s December-quarter results. Meta more than delivered for its December quarter and guided current quarter revenue to $53.5 billion-$56.5 billion, head and shoulders above the $51.37 billion consensus. That spurred some short covering, but the shares did fade some of those post-earnings gains to close January up in the high single digits. One item that stood out to us in Meta’s earnings was the slow growth in its number of family daily active people (DAP). That figure, nearly 3.6 billion, was up almost 7% year over year, but a more modest 1% compared to the September quarter. The days of growing the user base by leaps and bounds are over, which explains why Meta is focused on serving more ads and using AI to do so. That focus led the family's average revenue per person (ARPP) to jump 14.5% to $16.56 in the December quarter compared to $14.46 in the September quarter. Given seasonality factors in the December quarter, the year-over-year jump from $14.25 is even more impressive when we account for the 2024 presidential election. While Meta did not share revenue guidance for the full year, trends in the ARPP and even modest gains in DAP should translate into meaningful revenue growth in the coming quarters. 2026 will also be a full year of greater monetization on Threads and WhatsApp, and we have to wonder how long until Meta implements video on Threads, a move that, based on what we’re seeing with Instagram and Facebook, should drive even greater engagement and monetization. During the December quarter, Meta showed clear results of leveraging AI in its business, but it is also demonstrating how that effort is driving average revenue per person and operating cash flow higher, even as the company’s AI-related investments jump higher in 2026. Should we see META shares trend even higher in the near-term, despite our One rating, we will have to bow to our portfolio discipline should they move past a 4.5% position size. But we will remain sizable owners of META shares as upcoming investments aim to spin the advertising flywheel faster while the increasingly AI-laced ad business drives interaction and monetization higher.
January Price Change: 8.5%; Yield: 0.32%
INVESTMENT THESIS: Meta segments its business between Family of App Products, which includes Facebook, Instagram, Messenger, Threads, and WhatsApp, and Reality Labs Products, which includes its metaverse and investments and future product R&D. Family of Apps accounts for about 99% of the company's revenue and 100% of the company's operating profits. Substantially all of Meta’s revenue is currently generated from advertising on Facebook and Instagram. Family daily active people (DAP) were ~3.6 billion on average for the December 2025 quarter. Meta expects to spend $162-$169 billion on capex in 2026, a significant increase year over year, with most of this spending focused on AI infrastructure and initiatives. Meta is positioned to benefit from the ongoing shift toward digital advertising and the adoption of AI across its entire product offering. We recognize Meta is ramping up capital spending as part of the current AI arms race, but we see that as an investment that should drive productivity in its core advertising business. As the company harvests that investment, we could see a step up in margins, much like we saw in 2023.
Target Price: $850; Rating: One
Panic Point: $560
RISKS: Ability to add and retain users and user engagement; marketing spend; new products or changes to existing ones; competitive risk, geopolitical risk.
Nvidia Corp. NVDA; $191.13; 970 shares; 3.44%; Sector: Technology
UPDATE: Shares of Nvidia (NVDA) outperformed the S&P 500 in January, building on their impressive return in 2025. The month brought multiple data points of support for rising AI adoption and usage levels, as well as demand signals for AI and data center chips. Chief among them were the quarterly results and guidance from Taiwan Semiconductor as well as the comment from that company’s management team that AI is a megatrend. Our thinking remains that as adoption and especially that usage increase, it will drive demand for AI and data-center capacity as well as other aspects of digital infrastructure. During the company’s late-November earnings call, CEO Jensen Huang said the company has visibility into $0.5 trillion in chip revenue from “the start of this year through the end of calendar year 2026." Jensen also reiterated his bullish stance on the buildout of AI infrastructure, which he sees reaching $3 trillion to $4 trillion on an annual basis by the end of the decade. Measured against where we see current AI adoption and usage levels and Dell’s record backlog, we agree with that assessment on a directional basis, and that keeps us bullish on NVDA’s prospects. In late December, Nvidia announced its largest acquisition to date, spending $20 billion in cash to acquire AI chip startup company Groq. We view the acquisition as Nvidia using its balance sheet and cash generation to simultaneously extend its competitive position while also taking a potential competitor off the board. Given the price tag, however, we will be very interested to hear what Nvidia says about cross-marketing and revenue generation synergies, cost reductions, and margin enhancers as it discusses integration plans. Before we hear from Nvidia on that, next week brings quarterly results from Amazon and Alphabet, and what they say about capital spending plans for this year will be of interest for Nvidia and our other chip holdings. Shortly thereafter, the next set of potential catalysts will be January revenue reports from TSM and Foxconn.
January Price Change: 2.5%; Yield: 0.02%
INVESTMENT THESIS: Nvidia is well-positioned to benefit from ramping AI and data center spending. The company pioneered accelerated computing to help solve the most challenging computational problems. Nvidia is now a full-stack computing infrastructure company with data-center-scale offerings that are reshaping the industry. The company's full stack includes the foundational CUDA programming model that runs on all Nvidia GPUs, as well as hundreds of domain-specific software libraries, software development kits, or SDKs, and Application Programming Interfaces, or APIs. This deep and broad software stack accelerates the performance and eases the deployment of Nvidia accelerated computing for computationally intensive workloads such as artificial intelligence, model training and inference, data analytics, scientific computing, and 3D graphics, with vertical-specific optimizations to address industries ranging from healthcare and telecom to automotive and manufacturing. Nvidia reports in two business segments: Compute & Networking and Graphics. The Compute & Networking segment (78% of revenue, 85% of operating income) is comprised of Data Center accelerated computing platforms and end-to-end networking platforms, including Quantum for InfiniBand and Spectrum for Ethernet; NVIDIA DRIVE automated-driving platform and automotive development agreements; Jetson robotics and other embedded platforms; Nvidia AI Enterprise and other software; and DGX Cloud software and services. The Graphics segment (22% of revenue, 15% of operating income) includes GeForce GPUs for gaming and PCs, the GeForce NOW game streaming service and related infrastructure; Quadro/NVIDIA RTX GPUs for enterprise workstation graphics; virtual GPU, or vGPU, software for cloud-based visual and virtual computing; automotive platforms for infotainment systems; and Omniverse Enterprise software for building and operating metaverse and 3D internet applications.
Target Price: $250; Rating One
Panic Point: $160
RISKS: Market and interest rate risk, credit risk, country risk, and operational risk, including cybersecurity.
Palantir Technologies PLTR; $146.59; 1,205 shares; 3.28%; Sector: Financial Services
UPDATE: We’re not going to sugarcoat it, January was a challenging month for Palantir (PLTR) shares, which fell some 17% as concerns over software and software as a service business models pressured the stock and others in the space. That left the shares in an oversold condition ahead of the company’s upcoming earnings report early next week. When we added the shares to the Portfolio, we noted their relatively high beta and how that could lead to wide swings in the shares from time to time. As we’ve noted elsewhere in this month’s Roundup, January brought several confirming signals and data points for AI adoption, but arguably the expanded relationship between Palantir and HD Hyundai was the posterchild for expanding AI usage in the enterprise. It expands its business not only outside of the U.S., but it also does the same for its commercial exposure. In Q3 2025, Palantir’s U.S. revenue accounted for 75% of its total revenue, while commercial revenue represented 46% of total revenue. If Palantir does not offer more details on this expanded HD relationship when it reports its quarterly results on February 2, something we see as rather unlikely, we may be able to guesstimate its size by comparing remaining performance obligation (RPO) figures. Exiting September, Palantir’s total RPO stood at $2.6 billion, of which $1.14 billion was classified as short-term RPO and the remaining $1.46 billion as long-term RPO. Shortly thereafter, it was announced that U.K.-based AI infrastructure provider Sovereign AI selected Accenture and Palantir to help build and scale AI data centers across Europe, the Middle East, and Africa. The same project will use Dell AI Factory and Nvidia-powered technology to create what is being called “sovereign-grade AI capabilities.” That is part of the Accenture Palantir Business Group, a relationship announced in mid-December to help clients move from siloed data to integrated, AI-powered decision making. That speaks to one of the hurdles to enterprise AI adoption we’ve discussed with you, and much like the HD Hyundai expansion, it bodes well for continued growth in Palantir’s commercial and non-U.S. revenue stream. Subsequent to those back-to-back announcements, we used the January-to-date pullback to pick up more PLTR shares for the Portfolio. We have some room to add further, and Palantir’s quarter results and guidance next week may bring a reason to do so.
January Price Change: -17.5%; Yield: 0.00%
INVESTMENT THESIS: Palantir Technologies specializes in big data analytics and builds software platforms that help organizations integrate, analyze, and make sense of vast amounts of data for both commercial and government clients. While much has been made about the company’s exposure to the federal government, its software is used across 90 industries, and the larger global government sector accounted for 55% of revenue last year. The balance was from the commercial sector. Exiting Q3 2025, Palantir’s Commercial remaining deal value (RDV) stood at $3.63 billion, up from $1.79 billion exiting 2024. We will continue to monitor Palantir’s RDV and deferred revenue metrics, but in our view, key items to watch will be the continued diversification of its customer base across industries and increasing revenue per customer. Both have made considerable progress so far in 2025, with Commercial revenue expected to account for 33% of total revenue this year, up from 24.5% in 2024. Because we are still in the relatively early innings of AI adoption, we are inclined to be long-term owners of PLTR shares.
Target Price: $220; Rating: One
Panic Point: $150
RISKS: Economic and IT budget spending risk, technology risk, competition and competitive pressures, and customer acquisition risk.
ServiceNow NOW; $116.85; 1,435 shares; 3.09%; Sector: Technology
UPDATE: Shares of ServiceNow (NOW) were among the hardest hit during January, falling more than 20%, which many would say lands in the camp of a correction. That same move left NOW in an oversold condition as we closed out the first month of 2026. What’s weighing on the stock, irrespective of the December-quarter earnings beat, 25% year-over-year increase in remaining performance obligations (RPOs), and management’s 2026 guidance for a more than 20% increase in subscription revenue, the market is still plagued by concerns that Gen AI is eating away at the demand for software. Clearly, that guidance and the supporting RPO figures push back on that concern. Meanwhile, ServiceNow’s upsized share-repurchase program and the expedited $2 billion repurchase activity that is coming “imminently” should help NOW shares find their footing. As we see it, those RPO metrics and guidance confirm the company’s story is intact. However, for the shares to start working again, the company will need to further overcome the market’s concerns about generative AI. This means it will take at least another quarter of continued RPO growth with further gains for its AI-facing business. In the December quarter, that Now Assist business doubled year over year, surpassing $600 million in average contract value, and the company targets at least $1 billion for this year. Given recent relationship announcements with Anthropic, OpenAI, and others, that target is likely to prove conservative. In the past, we’ve seen market sentiment weigh on and at times restrain a company’s stock, only to see it rebound and push higher as the company continued to execute. With AI adoption and usage rising in the enterprise and companies needing to overcome the data silo problem, we will stay the course with NOW. If we see NOW land deep in oversold territory again, we may nibble on some shares to improve our cost basis. Recognizing NOW has become a "show me" story, we dialed back our price target to $185. Normally, that would lead us to downgrade NOW to a Two rating from One, but given where the shares are and the oversold condition they are in, we’ve kept our One rating intact. We’ve read indications that ServiceNow CEO Bill McDermott has plunked down $20 million of his own money to buy NOW shares this week. Should we get formal confirmation of that in the form of a filing with the SEC, it would be a powerful sign of support and one that could lead us to nibble around the edges, adding to the Portfolio’s position. That said, we will continue to track program wins and quarterly RPO figures closely. Should we see those levels decline two quarters in a row, that would be a warning sign we would act on.
January Price Change: -23.7%; Yield: 0.00%
INVESTMENT THESIS: The addition of ServiceNow adds exposure to the enterprise as it deploys AI-enabled solutions across its enterprise workflow platform. The company’s “Now Platform” is a cloud-based solution with embedded AI and machine learning (ML) capabilities that help unify and digitize workflows, driving productivity. At the heart of it, the company’s platform automates workflows across an entire enterprise by connecting disparate departments, systems, and silos in a seamless way to unlock productivity. ServiceNow counts more than 8,100 global customers, including 85% of the Fortune 500, with 97% of its revenue from subscriptions that have notched a 98% renewal rate. During the March 2025 quarter, ServiceNow also announced plans to acquire Moveworks, which offers front-end AI assistant and enterprise search technology, and Logik.ai, which provides AI-powered, and composable configure, price, and quote solutions for sales teams. We see these moves augmenting its offering and helping pave the way for further adoption of AI and subscription-based revenue.
Target Price: Reiterate $185; Rating: One
Panic Point: $118
RISKS: Industry and economic risk, competition and competitive pressures, and acquisition risk.
SuRo Capital SSSS; $9.34; 23,125 shares; 4.01%; Sector: Financial Services
UPDATE: We picked up more shares of SuRo Capital (SSSS) on January 26, using the mismatch between their move lower and the sizable pop in one of SuRo’s larger investments, CoreWeave CRWV, following news of a fresh investment by our own Nvidia, to our advantage. As we discussed when SuRo shared its initial Q4 2025 portfolio update, SuRo exited December with a meaningful position in CRWV shares, and January to date, we’ve seen a notable increase in them. Our thinking is that this increases the odds SuRo further unwinds its position in CoreWeave, a move that would provide fuel for dividends in the coming quarters. Making this move positions us for that rather nicely. The move up in CRWV shares should also benefit SuRo’s net asset value per share, as should the recast valuation for its position in OpenAI. Remember, the last time SuRo updated the fair value for its OpenAI position was as of September 30, when OpenAI’s valuation was ~$300 billion. Subsequently, OpenAI closed a round of investment that left its valuation around $500 billion, and as we discussed last week, OpenAI is now at $750 billion-$830 billion. If that is the post-round valuation, there would be a significant jump in the fair value of SuRo’s position in OpenAI compared to $27.7 million exiting September 2025. Near the end of January, reports indicate OpenAI is pursuing a Q4 2026 IPO. Such an event would be positive for SuRo’s net asset value and our dividend stream. While SuRo is closely associated with OpenAI and CoreWeave, let’s remember there are 33 other investments in its portfolio, with sizable ones in Whoop and Blink Health, as well as in Canva, Vast Data, and Plaid. Whoop CEO Will Ahmed has said that company could go public this year or next. Market expectations are that Canva will go public this year, and Plaid late this year or in 2027. When SuRo reports its December-quarter results in late February/March, we will look to learn more about its TensorWave investment. Based on the updated NAV per share, we’ll revisit our price target as needed. We will also keep our eyes peeled for the next dividend announcement.
January Price Change: -1.1%; Yield: 5.30%
INVESTMENT THESIS: SuRo Capital is a business development company (BDC) that invests in high-growth, venture-backed private companies. As SuRo monetizes those portfolio investments through either IPO or M&A transactions, it must pay out most of its earnings to shareholders in the form of dividends. What’s important to factor into our thinking is that SuRo’s strategy isn’t to hold public company investments but rather to monetize them following the lock-up expiration. Sometimes this can be immediate, and sometimes it can be in stages, but when that monetization occurs, it triggers dividend payments. And because a BDC must pay out at least 90% of its taxable income through dividends to shareholders, there is the possibility of a special dividend to hit that qualifying threshold late in the year. As we think about this, it means that we should focus on total return with SSSS, which is defined as capital gains in the shares plus dividends received while owning them. What this means is even if we see SSSS shares trade sideways or move lower, depending on the size of the dividend payments in the coming quarters, the position’s total return could still be sizable for the Pro Portfolio. SuRo's portfolio holdings at the end of June included CoreWeave, ServiceTitan, OpenAI, Liquid Death, Whoop, and fintech company Plaid, as well as roughly 30 other holdings.
Target Price: $12; Rating: One
Panic Point: $8.00
RISKS: Industry and economic risk, competition and competitive pressures, and acquisition risk.
Waste Management WM; $222.22; 900 shares; 3.71%; Sector: Industrials
UPDATE: The arguably boring business that is Waste Management (WM) saw its shares climb as we moved through January. However, the combination of that cumulative move higher and the late-January extreme winter weather led us to proactively lock in some sizable gains at $231.77 on January 28. That proved to be the smart move after seeing the post-earnings dip in the shares, which led WM shares to finish January little changed. As we see it, the core story of pricing power and leveraging the combination of automation and cost containment at the core WM business remains in place. Management is also delivering on growing the "Healthcare Solutions" business, which posted a more than 50% increase in net operating revenue in the most recent quarter compared to year-ago levels. That business is still a relatively small part of WM’s overall revenue stream, but as we know from our position in Labcorp, medical testing and its waste will continue to grow as the population ages and new tests are approved. We continue to like the long-term prospects for that business as WM management continues to pull costs out of it. We should see further improvement in margins and opex leverage at the legacy WM business as management targets a price increase between 5.4%-5.8% for that business. An average price increase of 3% is also targeted for the Healthcare Solutions business. That suggests we should continue to see robust operating cash flow and free cash flow. But that isn’t much of a surprise, because WM previously announced it would increase its 2026 quarterly dividend per share by 14.5% to $0.945 and restart its share repurchase program to the tune of $2 billion in 2026. During the earnings call, management said it sees share-repurchase activity continuing beyond this year, but the level will depend on investment opportunities. Reading between the lines, that likely means nip-and-tuck acquisition volume for the fragmented U.S. waste industry, and maybe something on the medical waste front. In 2025, Waste invested more than $400 million in nip-and-tuck waste acquisitions, and those should be thought of as targets for automation and cost reduction efforts. For now, that’s enough for us to maintain our $255 price target. As we see management’s initiatives on both businesses bear fruit, we’ll revisit that target. Should WM shares rebound back to the $230 level, something that would leave around 10% upside to our current price target, we’d be inclined to revisit our One rating.
January Price Change: 0.8%; Yield: 1.72%
INVESTMENT THESIS: Waste Management’s core business is the inelastic waste removal business for residential, enterprise, and other customers. The company has built its footprint through a series of acquisitions and excelled at wringing costs out of them, driving free cash flow, dividends, and funding incremental acquisition activity. While the residential business is sticky, the commercial business should continue to benefit from non-residential construction activity. Margins should continue to inch higher due to disciplined pricing and increasing use of automation. We are in the early days of WM Healthcare Solutions, but we see the business growing as management integrates and cross-sells against its core business and flexes the ability to integrate nip-and-tuck acquisitions as it has at the core waste business. Here, too, we see room to consolidate a fragmented industry, which makes this a natural fit for Waste Management.
Target Price: $255; Rating: One
Panic Point: $190
RISKS: Industry and economic risk, competition and competitive pressures, and acquisition risk.
TWOS
Alphabet GOOGL; $338.23; 677 shares; 4.25%; Sector: Communication Services
UPDATE: After dipping modestly in December, shares of Alphabet (GOOGL) resumed their move higher, rising more than 7% in January. We continue to see Google very well positioned in the AI race as it flexes its Search, shopping, and YouTube efforts to benefit its Gemini models. The inclusion of Gemini in its Search tools helped Google end 2025 on a strong note with the highest global search engine market share figure of the year. We see further gains ahead for Google AI efforts, including the AI relationship with Apple for the upcoming AI-enabled Siri refresh. We also see opportunities for Google to leverage AI with its advertising efforts, which should improve pricing and margins similar to what we saw in Meta’s December-quarter earnings report. Also similar to Meta, we are likely to see Google step up its capital spending efforts, and that effort could restrain margins at Google Cloud. As cloud capacity more closely matches demand, we would expect to see margins march higher, like what we expect with Microsoft’s Azure business. As we move through 2026, we will continue to monitor Google’s advertising efforts, which have included more ads on YouTube and could eventually include ads in Gemini. We are also interested to see how the company expands its YouTube TV plans, a move that has the potential to expand the world’s biggest video platform further as it takes more share from broadcast and cable competitors. Alphabet will report its December-quarter results after the market close on February 4.
January Price Change: 8.1%; Yield: 0.27%
INVESTMENT THESIS: We believe that while search and digital ad dominance are what will carry the shares in the near-to mid-term, longer-term, it is the company's artificial intelligence "moat" that will provide for new avenues of growth. Exiting October 2025, Alphabet surpassed 300 million paid subscriptions across Google One and YouTube. AI is what has made the company's search, video, and targeted ad capabilities best-in-class and is the driving force behind the company's success in voice (Google Home) and autonomous driving (Waymo). Furthermore, we believe it is this AI expertise that will also make the company more prevalent in other industries, including healthcare via its subsidiary Verily, as AI and machine learning continue to disrupt operations across industries. As of late 2025, Google's Gemini app had over 650 million monthly active users. Adding to our positive view of the company's future opportunities, we believe that Alphabet's free cash flow generation and solid balance sheet set it apart and are what will allow the company to continue taking chances on far-out, ground-breaking, and potentially world-changing projects, as well as fund capital returns to shareholders. We will continue to monitor advertising spend as well as the competitive landscape for the company’s core Search and Advertising business. Should we see GOOGL shares pull back near the 50-day moving average, near $295, that incremental upside to our price target would give us sufficient reason to revisit our Two rating.
Target Price: Reiterate $350; Rating: Two
Panic Point: $263
RISKS: Regulatory risk (data privacy), competition, and macroeconomic slowdown impacting consumers and therefore ad buyer activity.
American Express AXP; $352.23; 640 shares; 4.19%; Sector: Financial Services
UPDATE: Shares of American Express (AXP) were a stalwart during Q4 2025, with gains put in each month of the quarter. The shares continued to advance until mid-January, when President Trump voiced that he would like to see a cap of 10% on credit card interest rates put in place by January 20. Even though Amex derives ~72% of its pre-tax income from its net card fee revenue stream, the shares traded off. Following the company’s December-quarter earnings report on January 30, which contained EPS that missed consensus expectations by $0.01, AXP shares traded off, ending January down more than 5%. While we understand the market’s knee-jerk reaction given the current mood, that ever so slight bottom-line miss should not have overshadowed the more-robust-than-expected 2026 guidance and the company’s 16% dividend increase. Exiting the December quarter, Amex had 152.8 million cards in force, up from 146.5 million at the end of 2024. We attribute that to the Platinum card refresh effort, which also lifted Amex’s average feed per card to $122 at the end of 2025 compared to $108 exiting 2024. As we look back on 2025, the average number of cards in force was ~150.2 million, with an average net fee card near $117. And the trend of Amex members spending more on their cards continues, with average proprietary basic card member spending hitting $6,696 in the quarter, up almost 5% compared to Q4 2024. Annualizing the December-quarter metrics alone goes a long way to support Amex’s 9%-10% expected revenue increase for 2026 as well as the larger increase it sees for its bottom line. By the numbers, Amex guided 2026 revenue to be up 9%-10% and EPS to be in the range of $17.30-$17.90. Guidance gives us extra cushion for our $400 price target, but we recognize two things. First, while we’ve moved past President Trump’s January 20 deadline for a 10% credit card cap, it is likely to be an overhang until the president abandons the increasingly criticized plan that would hobble consumer spending. Second, given the increasingly “show me” sentiment driving the market, it will need to see the Platinum card fresh and similar programs at Amex continue to drive cards in force and average fee per card higher. Those factors could restrain Amex shares in the near term, but with 231 days until we reach the current Platinum card refresh anniversaries, we see more gains ahead for Amex and the shares. As we wait for supporting data points, we’ll be happy to collect the company’s forthcoming quarterly dividend increase of 16% per share to $0.95. With a near 4.1% AXP position size in the Portfolio, we are not inclined to add more shares, however, we will continue to assess entry points for members whose position sizes are below the Portfolio’s.
January Price Change: -4.8%; Yield: 1.03%
INVESTMENT THESIS: American Express is a globally integrated, membership-driven payments company, providing customers with access to products, insights, and experiences that enrich lives and build business success. The company has four reportable operating segments: U.S. Consumer Services (USCS), Commercial Services (CS), International Card Services (ICS), and Global Merchant and Network Services (GMNS). American Express targets the premium consumer space by continuing to deliver membership benefits that span our customers’ everyday spending, borrowing, travel, and lifestyle needs, expanding its roster of business partners around the globe, and developing a range of experiences that attract high-spending customers. In 2025, the company’s net card fee revenue accounted for 72% of its pre-tax income, which we see providing a differentiated business model that should continue to grow as Amex wins new card members and drives its average fee per card higher.
Target Price: Reiterate $400; Rating: Two
Panic Point: $315
RISKS: Slowdown in consumer spending, competition, membership growth, merchant acceptance, and lack of new product innovation.
Apple AAPL; $259.48; 825 shares; 3.99%; Sector: Technology
UPDATE: While Apple (AAPL) shares rebounded late in January following stellar December-quarter results, they still posted a mid-single-digit decline in January. As we explained in our analysis for the quarter, data points leading up to Apple’s earnings suggest a strong iPhone quarter, and paired with a favorable product mix skewed toward higher-end models and another robust quarter for the Services business led to the consensus-topping results. Turning to Apple’s outlook for the current quarter, it guided overall revenue to be up 13% to 16% year over year, which implies about $107.5 billion to $110.6 billion as it contends with “constrained iPhone supply in the quarter.” The positive is that guidance tops the $105 billion the market was forecasting. That 23% to 25% top-line decline compared to the $143.8 billion posted in the December quarter also reflects seasonal weakness and lower shipment volumes across the balance of its Product business. But as we saw in the March 2025 quarter, this is when we really see the power of the higher margin Services segment, which is expected to grow double-digits year over year. That should help Apple maintain or potentially see a modest uptick in overall gross margins compared to the 48.2% achieved in the December quarter. On a year-over-year basis, that suggests some nice margin expansion prospects. We know Apple only guides one quarter at a time, but the next known, meaningful catalyst for AAPL shares will be when Apple unveils its revamped, AI-enabled Siri. The first look is expected to come with the upcoming iOS 26.4 beta release targeted for the second half of February and wider availability in March or early April. But as we are learning, this is just the beginning. Reports indicate Apple plans to unveil a fully reimagined Siri at this year’s WWDC, one that will be conversational, aware of relevant context, and capable of sustained back-and-forth dialogue. While this next evolution in Siri will be seen at WWDC in June, the first opportunity to test it in the wild will come with the beta version of iOS 27, iPadOS 27, and macOS 27 this summer. We continue to think that if Apple is able to delight consumers with this initial AI-enabled Siri and even more so with the reimagined one, that would ignite the massive upgrade cycle we and others have been waiting for. For now, we’ll maintain our current AAPL price target of $305, and as we test the iOS 26.4 Siri beta, we’ll revisit it as needed. And even though AAPL is a relatively full position for us, we’ll continue to evaluate levels that make sense for folks looking to increase their holdings in the shares. Upcoming catalysts include January revenue reports from Taiwan Semi and Foxconn, as well as any Winter-Spring 2026 Apple event.
January Price Change: -4.6%; Yield: 0.38%
INVESTMENT THESIS: While we acknowledge that near-to-midterm performance remains heavily influenced by iPhone sales, the dynamic is shifting as investors finally place greater emphasis on Services growth. We are bullish on the 5G upgrade cycle and believe longer-term upside will continue to come as Services revenue grows its share of overall sales. Services provide for a recurring revenue stream at higher margins, a factor that serves to reduce earnings volatility while allowing for a higher percentage of sales to fall to the bottom line; as a result, we believe that Services growth and the installed base are much more important than how many devices the company can sell in each 90-day period. In addition to improved profitability, we also believe the transparent nature of this revenue stream will demand an expanded price-to-earnings multiple as segment sales grow. Furthermore, we believe that Apple's desire to push deeper into the healthcare arena will help make its devices invaluable as more life-changing features are added and the company works to democratize health records.
Target Price: Reiterate $305; Rating: Two
Panic Point: $222
RISKS: Slowdown in consumer spending, competition, lack of new product innovation, elongated replacement cycles, and failure to execute on Services growth initiatives.
Bank of America Corp. BAC; $53.23; 4,000 shares; 3.96%; Sector: Financial Services
UPDATE: In early January, we bowed to our portfolio discipline and trimmed back the Portfolio’s exposure to Bank of America (BAC) when the position size crossed above 4.5%. That of course meant we locked in a tremendous gain on January 5 when we sold that slug of shares at $57.21, roughly a 99% gain. After the trade, we continued to remain large shareholders of BAC because the IPO market and M&A activity are poised to remain vibrant in the coming quarters, and the potential for loan activity to improve as the interest rates continue to move lower. Following BofA’s December-quarter results, which topped market expectations, the narrative remains one of continued gains in net interest income, ramping investment banking business, and cost containment. BofA targets 200-basis points of operating leverage this year, and part of that includes its ongoing AI and digitization efforts as it aims to keep a lid on employee expansion. As CEO Brian Moynihan pointed out on the earnings call, headcount remains a key driver of the company’s expenses. Offsetting those positives that would normally have led us to boost our BAC price target was the uncertainty injected by President Trump, who wants to put a one-year 10% cap on credit card rates. In our view, such a move would translate into consumers losing access to credit, a headwind for consumer spending and the economy. We will follow developments on this front and act accordingly based on what we learn, but we will say the nearly 4% pullback in January has us re-thinking our current Two rating.
January Price Change: -3.2%; Yield: 2.04%
INVESTMENT THESIS: Bank of America is one of the world's leading financial institutions, serving individual consumers, small- and middle-market businesses, and large corporations with a full range of banking, investing, asset management, and other financial and risk management products and services. The company provides unmatched convenience in the United States, serving approximately 69 million consumers and small business clients with approximately 3,700 retail financial centers, approximately 15,000 ATMs, and award-winning digital banking with approximately 59 million verified digital users. Bank of America is a global leader in wealth management, corporate and investment banking, and trading across a broad range of asset classes, serving corporations, governments, institutions, and individuals around the world. Bank of America offers industry-leading support to approximately 3 million small business households through a suite of innovative, easy-to-use online products and services. The company serves clients through operations across the United States, its territories, and approximately 35 countries. From a reporting perspective, the company's business breaks down as follows: Net Interest Income breakdown: Consumer Banking 57%, Global Banking 23%, Global Wealth & Investment Management 14%, and Global Markets 6%; Income Before Tax breakdown: Consumer Banking 42%, Global Banking 27%, Global Wealth & Investment Management 16%, and Global Markets 15%. Bank of America pays a quarterly dividend of $0.28 per share, up from $0.18 a few years ago.
Target Price: $65; Rating: Two
Panic Point: $47
RISKS: Financial markets, fiscal, monetary, and regulatory policies, economic conditions, and credit ratings.
Broadcom Inc. AVGO; $331.30; 460 shares; 2.83%; Sector: Technology
UPDATE: When we initiated the Portfolio’s position in Broadcom (AVGO) in mid-December, we detailed our plan to build up exposure over time, using pullbacks in the shares or signs of strengthening end-market demand to do so. January brought both, and we used that to pick up more shares, first in mid-January, which we funded with the exit of the Portfolio’s remaining Qualcomm (QCOM) shares. Roughly a week later, we picked up more shares following very bullish comments about AI and data center demand from Taiwan Semiconductor and Micron's recent quarterly earnings report. Those comments and corresponding guidance support the consensus forecasts that call for Broadcom to deliver EPS growth of 50% in fiscal 2026 and 38% in 2027. Said a different way, Broadcom is expected to more than double its annual EPS between fiscal 2025 and fiscal 2027. Backing that expectation is the company’s $73 billion in backlog that Broadcom management expects to ship over the next six quarters, as well as the expectation for continued AI order growth. Part of that stems from its position in the custom AI chip space, which complements our exposure with Marvell. But that $73 billion is less than half of Broadcom’s overall backlog of $162 billion, which is up from $110 billion exiting the company’s August quarter. As we saw this week, AI and data center capital spending levels are set to step up further in 2026, and that keeps us both bullish and patient with AVGO shares. We have some room to add further to our AVGO position, and, at current levels, we are also revisiting our Two rating following the almost 5% decline in the shares for January.
January Price Change: -4.3%; Yield: 0.75%
INVESTMENT THESIS: We became shareholders in Broadcom to participate as the company benefits from the buildout of digital infrastructure, including AI, data center, and custom AI chips, as well as demand for its software and services segment, which includes private cloud, mainframe software, cybersecurity, and enterprise software. Broadcom reports its business in two segments – Semiconductor Solutions (58% of sales and 51% of operating income) and Infrastructure Software (42%, 49%). The Broadcom management team has developed a track record of delivering organic growth and growth by acquisition, with the latter positioning the company to better position itself to meet developing demands. More recent acquisitions include Brocade Communications, CA, Inc., Symantec Enterprise Security, and VMware.
Target Price: $445; Rating: Two
Panic Point: $290
RISKS: Economic, governmental regulations, geopolitical developments, cyclical, and investment risk.
Dutch Bros BROS; $54.34; 3,678 shares; 3.70%; Sector: Consumer Cyclical
UPDATE: Following the 17% gain in Q4 2025, shares of Dutch Bros (BROS) gave back a sizable slug of those gains in January, landing them in oversold territory closing out the month. The key for us when it comes to BROS is the company’s continued footprint expansion. Exiting 2025, it had 1,081 shops with plans to add ~175 this year, but we see a greater step up in the coming years to hit its 2029 target of 2,029 shops. While the company did not formally announce new locations, we’ve identified new ones in Texas, Illinois, Iowa, and California during January. That builds on the new ones we identified in December in North Carolina, Kentucky, and other states. Helping accelerate that expansion plan, in mid-January, Dutch Bros, it announced a deal to acquire Clutch Coffee and its 20-store drive-thru-only coffee shops across the Carolinas. This was a new salvo in Dutch’s expansion plan, and when it reports its December-quarter results, we’ll be interested in what is said about management’s appetite for similar nip-and-tuck expansion opportunities. We also look forward to more definitive plans for the company’s gestating menu expansion, a move that should increase average ticket size. Current consensus expectations have Dutch delivering more than a 30% increase in EPS in 2026 vs. 2025. When Dutch reports, we’ll be interested in how it factored falling dairy prices into its outlook, given dairy is a key input cost for coffee companies like Dutch.
January Price Change: -11.2%; Yield: 0.00%
INVESTMENT THESIS: Dutch Bros is an operator and franchisor of drive-thru shops that focus on serving high-quality, hand-crafted beverages with unparalleled speed and superior service. Coffee-based beverages make up about 50% of the menu mix, and about 25% of the menu mix is based on the company’s proprietary Blue Rebel energy drink, which is highly customizable with flavors and modifiers and can be served blended or over ice. The energy platform helps unlock the afternoon day part and broadens the company’s appeal. The remaining 25% of the menu mix is a wide variety of teas, lemonades, sodas, and smoothies. The company’s west-to-east expansion is a time-tested strategy that should drive revenue and EPS growth over the next several years. Leveraging that footprint expansion and low-single-digit comp sales growth, management reiterated its long-term guidance of around 20% annual revenue growth. Helping support that guidance, the company confirmed it will introduce an expanded food menu in 2026. Dutch Bros is slated to enter the consumer-packaged goods (CPG) space in a deal with Trilliant Food & Nutrition.
Target Price: Reiterate $75; Rating: Two
Panic Point: $52
RISKS: Commodity risks, labor costs, interest rate risk, and inflation.
Labcorp Holdings Inc. LH; $271.46; 790 shares; 3.98%; Sector: Healthcare
UPDATE: After rising more than 9% in 2025 and paying our $2.88 per share in dividends during 2025, shares of (LH) chugged higher in January. While it may not be a sexy business or one that generates much in the way of headlines, the company remains a well-positioned play for our Aging of the Population investing theme. During January, Labcorp expanded its molecular residual disease (MRD) portfolio to include panels for patients with stage I–III breast cancer or stage I–IIIA non-small cell lung cancer, and the nationwide availability of a whole-genome MRD test for stage III colon canc1er. We see that as the latest step in the company’s expanding array of testing and diagnostic solutions, which complements its acquisition and outsourced hospital lab strategies. As the company explained during its September-quarter earnings call, some of the expected acquisitions for Q3 2025 are closing later than expected, and a few have slipped into 2026. That suggests the company should deliver a quicker pace of EPS growth in 2026 than implied by the consensus EPS of $17.52 compared to $16.33 in 2025. Another driver of EPS upside is Labcorp’s cost-reduction initiatives and how it is adopting AI, the combination of which should help drive margins higher over time. While the Portfolio has a relatively full LH position, we will continue to look for potential entry points for members. Labcorp will report its December-quarter results on February 13 and pay its next quarterly dividend of $0.72 per share on March 12 to shareholders of record as of February 27.
January Price Change: 8.2%; Yield: 1.15%
INVESTMENT THESIS: Labcorp is a global leader in innovative and comprehensive laboratory services that provide vital information to help doctors, hospitals, pharmaceutical companies, researchers, and patients make clear and confident decisions. By leveraging its diagnostics and drug development capabilities, the company provides insights and accelerates innovations to improve health and improve lives. The company is organized under two segments, consisting of Diagnostics Laboratories (Dx), which includes routine testing and specialty/esoteric testing, and Biopharma Laboratory Services (BLS), consisting of Early Development Research Laboratories and Central Laboratory Services. Our attraction to LH shares stems from the combination of the aging population driving diagnostic testing growth and the increasing array of diagnostic testing as well. That combination is expected to drive the healthcare testing services market to $12.6 billion by 2029, from $7.4 billion in 2024, according to Markets and Markets. To augment its position in oncology, women's health, autoimmune diseases, and neurology, the company has been expanding through acquisitions and partnerships with health systems and regional and local labs.
Target Price: Reiterate $300; Rating: Two
Panic Point: $228
RISKS: Macroeconomic factors, changes in healthcare reimbursement models and products, government regulations, product discontinuations, or recalls.
Microsoft Corp. MSFT; $430.29; 395 shares; 3.14%; Sector: Technology
UPDATE: Following a challenging second half Q4 2025, shares of Microsoft (MSFT) bounced around in the first few weeks of January, but ultimately finished the month down more than 10%, landing back at levels we haven’t seen since late April. Despite an upside surprise for the December quarter, the market was underwhelmed by Microsoft’s ability to monetize capital spending efforts in recent quarters. Granted, Microsoft’s commercial remaining performance obligation (RPOs) increased to $625 billion, up more than 100% year over year and significantly compared to $392 billion at the end of September. But that should not be a surprise, given the December-quarter commitments from OpenAI for $250 billion to Azure. Misleading headlines about slowing cloud growth also weighed on MSFT shares. Technically speaking, the March 2026 revenue growth guidance of 37.5% is slower than the 39% posted in the December quarter, but context is everything. Two things should add some much-needed perspective. First, for the March quarter, the consensus revenue growth forecast was 36.4%, which means at the midpoint of Microsoft’s guidance, it’s a full percentage point better than expected. Second, that 37% to 38% compared to the 33% increase in revenue posted during the March 2025 quarter. The bottom line is that the issue that has plagued Microsoft in recent quarters remains in place — customer demand continues to outstrip supply, and that continues to restrain Microsoft from monetizing its RPOs at a quicker pace. The “problem” is we’ve heard this before, and the timetable for it being remedied is further down the road. What the market is waiting for is for Microsoft to put enough capacity in place to effectively monetize the business it has been booking. We are also in that camp. The reality is it may take longer than the market expects, especially if AI adoption and usage in the enterprise accelerates as some third-party forecasts call for. But with MSFT shares now back at levels we haven’t seen in a few quarters, and with its RPOs more than $300 billion higher compared to the $315 billion at the end of March, as painful as it may be, the prudent move is hold to the course. While this may feel like the worst, when we look at those RPO gains and growing AI adoption, let’s remember that sometimes you have to get through the worst to get to the best. We will continue to track Microsoft’s RPOs, and if we see warning signs, that will be a signal for us. Elevated capex levels and losing business are not a place to be. Fortunately, that’s not the picture we see. Subject to cash levels, where the shares settle out and other opportunities in front of us, we will consider picking up some additional MSFT for the Portfolio.
January Price Change: -11.0%; Yield: 0.75%
INVESTMENT THESIS: We believe the cloud to be a secular growth trend and that the upside to the shares will result from Microsoft's hybrid cloud leadership as the company grabs market share in this expanding industry. While companies may look to build out multi-cloud environments, Microsoft's Azure offering will be a prime choice thanks to its decision to provide the same "stack" used in the public cloud to companies for their on-premises data centers. Additionally, we would note that hybrid environments are currently the preference for most companies because they allow them to maintain critical data in-house while taking advantage of the agility and scalability provided by public clouds. Outside of the cloud opportunity, we maintain a positive view on the company's growing gaming business, which we believe is becoming an increasingly prominent factor in the Microsoft growth story as gaming becomes more mainstream, management works to convert its gaming revenue from a one-time license purchase to a recurring subscription model, and as technologies like augmented/virtual reality evolve. Finally, as it relates to LinkedIn and other subscription-based services such as O365 and various Dynamics products, we continue to value them highly for their recurring revenue streams, which, we remind members, provide for greater transparency of future earnings.
Target Price: $600; Rating: Two
Panic Point: $450
RISKS: Slowdown in IT spending, competition, and cannibalization of on-premises business by the cloud.
Morgan Stanley MS; $182.87; 1,238 shares; 4.20%; Sector: Financial Services
UPDATE: After climbing more than 40% in 2025, shares of Morgan Stanley (MS) ebbed and flowed in January, but finished the month up a couple of percentage points. As expected, strength in investment banking and further inroads for the investment banking business led Morgan Stanley to easily clear consensus expectations for its December quarter. Investment banking activity is expected to remain brisk this year, with a slate of high-profile and large IPOs that includes SpaceX, OpenAI, Anthropic, Databricks, Stripe, Revolut, and Canva. Those offerings are expected to be sizable, and that means IPO-related investment banking fees could jump higher. Per Dealogic, Morgan Stanley ranked as the #2 book runner for global IPOs in 2025 and #1 in 2024. That positions the firm rather well, but we’ll still want to see its place on upcoming S-1 filings for those mega deals when they land at the SEC’s website. With that in mind, as well as market volatility poised to benefit Morgan’s trading business, we lifted our MS price target to $205 from $185. That leaves just some nice upside from current levels to that new target. Should we see MS shares fall back to and successfully test the 50-day moving average near $176.65, and the signs point to the IPO market heating up, we would look to revisit our Two rating. We’ll also continue to monitor M&A activity, the other big driver of investment banking activity.
January Price Change: 3.0%; Yield: 2.25%
INVESTMENT THESIS: Morgan Stanley reports in three business segments: Institutional Securities (42% of trailing 12-month revenue, 38% of trailing 12-month Income Before Tax), Wealth Management (48%, 55%), and Investment Management (10%, 6%). While the IPO window has yet to reopen, the potential IPO class for 2025 continues to build with recent additions including Klarna and StubHub. That would be a boon to private equity firms and others that have been nursing IPO candidates during the dark period and a positive for Morgan Stanley's investment banking business. Expected deregulation under the Trump administration is a potential catalyst for Morgan's M&A business. Meanwhile, folks continuing to be behind in retirement savings bodes well for Morgan Stanley's wealth management business in the coming quarters, while continued market volatility bodes well for its equity trading business.
Target Price: $205; Rating: Two
Panic Point: $165
RISKS: Market and interest rate risk, credit risk, country risk, and operational risk, including cybersecurity.
TJX Companies TJX; $148.79; 947 shares; 2.63%; Sector: Financial Services
UPDATE: Our position in TJX Companies (TJX) climbed just over 18% last year, but the shares gave back a fraction of that gain in January. Both Visa and Mastercard estimated U.S. holiday shopping rose ~4% year over year, and both found spending on apparel was a strong category. At the same time, there is little question that consumers continued to feel the pinch of higher inflation, something that, per the Flash PMI report from S&P Global, has continued into 2026. This week, we learned the Consumer Confidence Index fell to 84.5 in January, a steep drop compared to December’s 94.2 figure. That January figure was also the lowest start of the year in 12 years. To that, we can add headcount reductions from Amazon, UPS, and Citigroup. Odds are we will see more of that as the current earnings season wears on. Those assembled data points bode well for TJX’s portfolio of off-price merchandise as cash-strapped consumers embrace deals, sales, and off-price retailers. It also suggests TJX’s comp sales guidance of up 2%-3% for its January quarter is likely to prove conservative. We continue to see the TJX team as a well-seasoned group with a disciplined eye for merchandise. Should we see TJX shares continue to trend lower, that could land them in an oversold condition. However, we are also closely following the shares relative to their 100-day moving average at $147.52. If TJX delivers a successful test of that level, we may be inclined to pick up a few shares. Let’s remember too, the company telegraphed it will continue to repurchase shares in the current quarter, which means any move back to that level could be short-lived. TJX repurchased $1.7 billion in stock, roughly 13.4 million shares, during the first nine months of its fiscal 2025 and targets repurchasing ~$2.5 billion during fiscal 2026, which ends in January 2026. This implies TJX will have bought back ~$0.8 billion in stock during the November 2025-January 2026 quarter. TJX will pay its next $0.425 per share quarterly dividend on March 5 to shareholders of record on February 12.
January Price Change: -2.5%; Yield: 1.11%
INVESTMENT THESIS: The TJX Companies is the leading off-price apparel and home fashions retailer in the United States and worldwide. It has over 5,000 stores and six branded e-commerce sites that offer a rapidly changing assortment of quality, fashionable, brand-name, and designer merchandise at prices generally 20% to 60% below full-price retailers’ regular prices on comparable merchandise. The company operates in four segments: Marmaxx and HomeGoods, both in the U.S.; TJX Canada, and TJX International. TJX looks to capitalize on opportunities to acquire merchandise at substantial discounts that regularly arise from the production and flow of inventory in the apparel and home fashions marketplace. These opportunities include, among others, closeouts from brands, manufacturers, and other retailers; special production direct from brands and factories; order cancellations; and manufacturer overruns. We see that positioning TJX extremely well, as consumers feel the pinch of ongoing inflation pressures and their efforts to stretch the disposable spending dollars they do have, including tapping discounted shopping locations.
Target Price: $165; Rating: Two
Panic Point: $132
RISKS: Operational, strategic buying, and competitive risks, as well as consumer spending patterns.
United Rentals URI; $781.70; 235 shares; 3.41%; Sector: Industrials
UPDATE: Leading up to the December-quarter earnings report from United Rentals (URI), we cautioned members that the extreme winter weather this past week would be a likely guidance headwind for the company’s weakest quarter of the year. What we didn’t see coming were the shortfall in higher margin, used equipment sales, and continued margin headwinds from elevated delivery expenses tied to fleet repositioning costs. Those factors weighed on margins, driving a bottom-line miss even though revenue for the December quarter was largely in line with the $4.2 billion market consensus. Given the current market mood that miss erased URI’s move higher ahead of that earnings report, leaving the shares to finish January down a low single-digit. As we moved past the prime construction season several months ago, we’ve more or less been on the sidelines with URI shares, and our intention was to remain so until we moved past the current winter season. As we’ve seen many times in the past, weather disruptions can be a real pain in the you know what, but given the size and scope of these large construction projects, they tend to result in modest delays and boil down to timing issues. Sweetening the bottom-line performance ahead, URI shared that it will use the $350 million remaining under its existing share repurchase program, and that it will be followed by a fresh $5 billion repurchase program. Management signaled it expects to repurchase that $350 million in the current quarter, and targets an additional $1.15 billion in 2026. Given the post-earnings selloff, we suspect United may tap that new program sooner rather than later. In addition to the re-armed buyback program, URI also said shareholders will be receiving a new dividend of $1.97 per share per quarter, which is a 10% increase over the prior quarterly payout. In the current environment, we’re likely to see some price target trimming, due to reset margin prospects, restraining the shares at least until more construction-friendly weather emerges. We played our part in that as we trimmed our price target to $950 from $1,000. Despite that distance from the current share price and the potential for more disruptive winter weather, we’ll wait in the wings for seasonal strength to emerge, and with it, better operating leverage.
January Price Change: -3.4%; Yield: 0.97%
INVESTMENT THESIS: United Rentals, the largest equipment rental company in the world, operates throughout the United States and Canada, and has a limited presence in Europe, Australia, and New Zealand. It serves industrial and other non-construction, commercial (or private non-residential) construction, and residential construction. Industrial and other non-construction rentals represented approximately 50% of rental revenue, primarily reflecting rentals to manufacturers, energy companies, chemical companies, paper mills, railroads, shipbuilders, utilities, retailers and infrastructure entities; commercial construction rentals represented approximately 46% of rental revenue, primarily reflecting rentals related to the construction and remodeling of facilities for office space, lodging, healthcare, entertainment and other commercial purposes; and residential rentals around 4% of revenue. We see the company benefiting on three fronts — the seasonal uptick in construction spending, the release of funds and projects associated with the five-year Biden administration infrastructure bill, data center construction and other re-shoring projects, and the company's nip-and-tuck acquisition strategy that should further enhance its geographic footprint.
Target Price: Reiterate $950; Rating: Two
Panic Point: $775
RISKS: Industry and economic risk, competition and competitive pressures, and acquisition risk.
Welltower Inc. WELL; $188.33; 750 shares; 2.62%; Sector: Real Estate
UPDATE: Following their Q4 2025 outperformance relative to the S&P 500, shares of Welltower (WELL) dipped modestly during January. However, they have been building support, hugging the 100-day moving average. That led us to pick up some additional shares for the Portfolio on January 27 at $183.18. After that trade, the stock bounced back to close January up around 1%. When we first started our position in Welltower in September, we noted our intention to increase our exposure over time because of the strong position it enjoys between the Silver Tsunami tailwind and the looming senior housing shortage. We see that driving pricing power in the form of favorable rent escalation which should translate into improved margins, EPS growth, and cash flow as utilization levels creep higher. Given Welltower’s REIT structure, that should also lead to further dividend increases. As the Fed moves further down the Fed Funds rate curve, we should see Welltower benefit from lower project hurdle rates and investors revisiting its dividend stream and corresponding yield. Per Senior Housing News, the senior housing industry-wide occupancy is still below 90%, which leaves some cushion, but it isn’t expected to last long. The 80+ age group is projected to grow by about 16% by 2028, which means the industry will be bumping up against capacity constraints unless new supply comes online. In H1 2026, Welltower will complete the announced divestiture of its outpatient medical portfolio, a move that leaves management focused on the senior housing business. In addition to the usual metrics, when Welltower reports on February 10 and holds its earnings call on February 11, we’ll want to hear more about the integration of the Barchester Senior Living portfolio acquired in Q4 2025.
January Price Change: 1.5%; Yield: 1.63%
INVESTMENT THESIS: Welltower, a real estate investment trust (REIT), owns interests in properties concentrated in major, high-growth markets in the United States, Canada, and the United Kingdom, consisting of seniors housing, post-acute communities, and outpatient medical properties. We see the company benefiting from the intersection of the demographic shift that is the aging population and the looming pain point that is the shortage of inventory for senior housing, which fell below 1% in Q2 2025, according to the National Investment Center for Seniors Housing & Care. Over the next five years, more than 4 million boomers will hit age 80, and that’s in addition to the roughly 4% of the U.S. population that is 80-plus years old in 2024. As this demographic shift unfolds, we should see a relatively steady growth rate in Welltower’s revenue, NOI, and FFO, which, in turn, given its REIT status, should drive its payable dividend stream higher. Because of the favorable demographic tailwind and lower interest rate path telegraphed by the Federal Reserve, which should reduce construction costs over time, as well as bring REIT stocks back into favor, we intend to be long-term holders of WELL shares. Our plan is to build the position size methodically, increasing the Portfolio’s dividend stream along the way.
Target Price: $205; Rating: Two
Panic Point: $165
RISKS: Operational risk, operator and tenant risk, competitive risks, and acquisition risk.
Not Rated
EPS Diplomats Model; 2.17%; Sector: N/M
UPDATE: On Dec. 31, we exited the eight holdings that comprised the model’s initial basket, and on January 2, we reconstituted the model with new positions in Credo Technology CRDO, Equinox Gold EQX, SiTime Corp. SITM, Pan American Silver PAA, Lumentum LITE, Kinross Gold KGC, Carvana CVNA, and IAMGold Corp. IAG, and reset the holdings for each model constituent back to 0.25%. Gains in the price of gold and silver led KGC, IAG, EQX, and PAAS to surge double digits through most of January. The late January selloff in gold and silver prices resulted in the basket giving up some of those gains, but it still finished January up more than 2%, multiples compared to the modest gain for the S&P 500. But let’s remember the smarter way to approach the move in those metal prices is to recognize that the month-to-date move in gold and silver will influence company guidance more than Friday’s selloff, as will the gains compared to average prices in Q1 2025 and Q4 2025. Given the nature of the model, the only time we may adjust its composition during the quarter is if a company is acquired. Otherwise, the model is set until the next reconstitution. As such, there are no price targets or ratings for each of the positions that make up the basket. That same selection process will be repeated quarterly, which means housekeeping for the model should be minimal. It also means you can expect minimal activity to occur at quarter-end and the start of the new quarter. As members become more familiar with the EPS Diplomats strategy, we may elect to increase the overall position size of the model’s basket, but that would only coincide with a reconstitution cycle. With that in mind, the next set of active dates for the model will be 3/31/26 and 4/01/26.
January Price Change: 2.2%
INVESTMENT THESIS: EPS Diplomats is a model of large-cap companies that offer the fastest rate of EPS growth over a multi-year period. That basket is screened regardless of industry sector or sub-sector, which means the down-selected list of companies can span a wide array of sectors. The focus is on earnings growth because earnings growth is often seen as a signal of a company's competitive strength, operational efficiencies, and future growth potential. Shares of companies that provide historically consistent earnings growth faster than the stock market receive premium valuations compared to those awarded to the S&P 500. And as we’ve often discussed with you, multiple expansion paired with earnings growth tends to drive outperformance relative to the market, better known as alpha. The basket of eight stocks is reconstituted on a quarterly basis to reflect updated EPS expectations for the current year and the following one.
Target Price: N/M
Panic Point: N/M
RISKS: Macro and end market risk, individual company risk, and consensus EPS expectations.
