Here's Why We’re Focused on AI Adoption and Usage Levels
While adoption is still in the early earnings, usage levels are just scratching the surface.
You've reached your free article limit
You've read 0 of 1 free Pro articles.
On and off again over the last several weeks, questions over a potential AI bubble have risen and fallen. Our stance is that we will be mindful of developments across the industry when it comes to financing and capacity levels, but we will also follow AI adoption and usage levels.
AI adoption across the enterprise, consumer, government, and related landscapes is still in the early innings, while usage levels based on numerous reports indicate companies are only scratching at the surface due to siloed data sets. What we’ll be watching and examining will be slowing incremental growth rates. While we may see them in user adoption figures, it may be some time until they rear their head in consumer and enterprise usage figures.
Looking at the Past
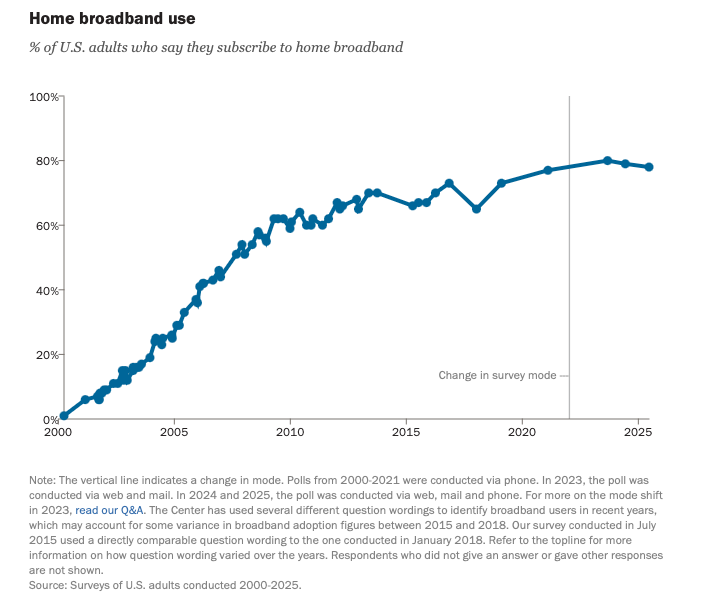
In reviewing the following charts that show U.S. internet usage, we can see adoption and usage climbed quickly in the early 1990s and slowed in 2001, but growth picked back up as home broadband penetration levels rose. It wasn’t until 2010 that home broadband use hit 60%, but U.S. internet growth had already started to slow in 2007 when home broadband use crossed the 50% line.
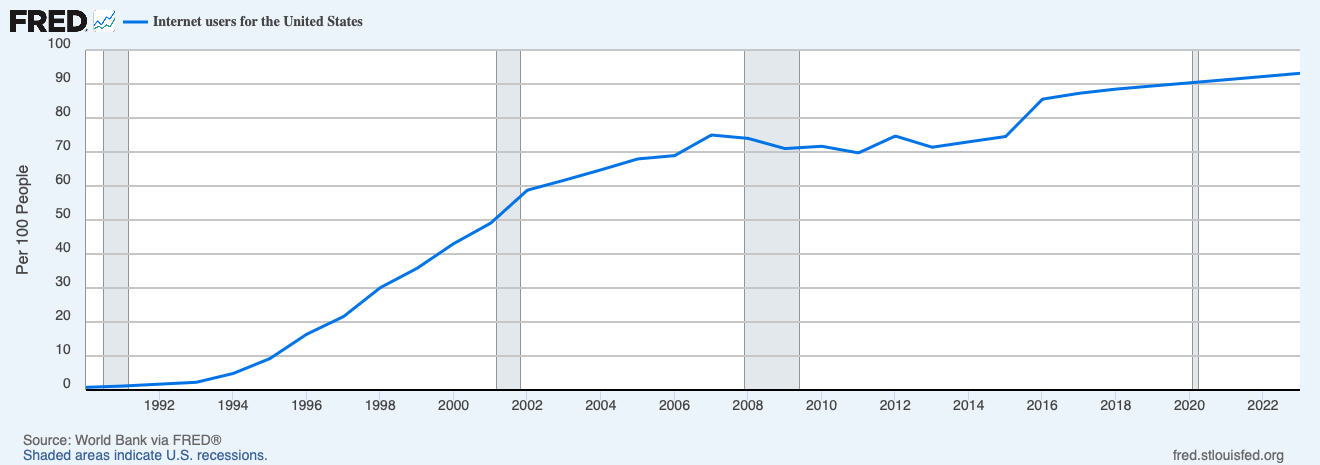
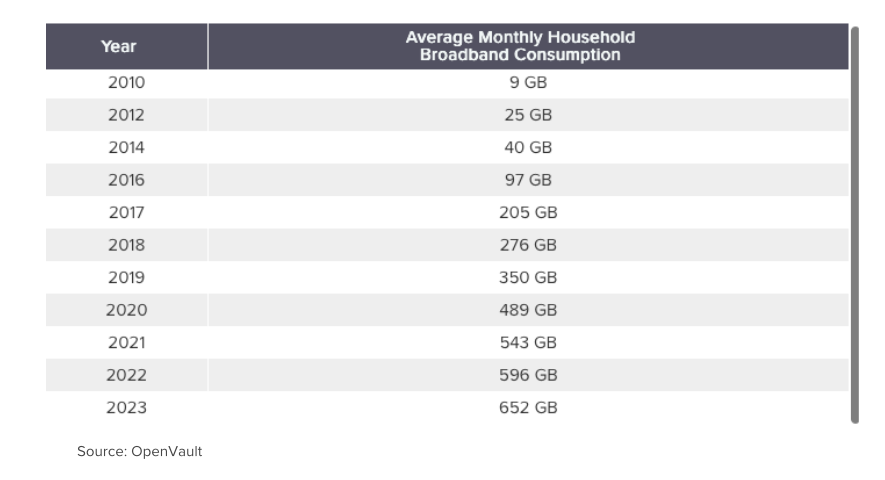
Yet data from OpenVault shows continued growth in the monthly household broadband consumption. We can trace that back to network improvements that offered improved network speeds and lower latency, as well as applications such as streaming video and audio, video calling, interactive gaming, and what we’ll call general internet usage, like search and shopping, banking and bill pay, etc.
The key here is that even though adoption levels for the number of internet users pretty much flatlined between 2006-2013, the amount of data consumed exploded as usage increased. Helping spur that on as well was the rise of the smartphone market, which helped chew on Wi-Fi network capacity.
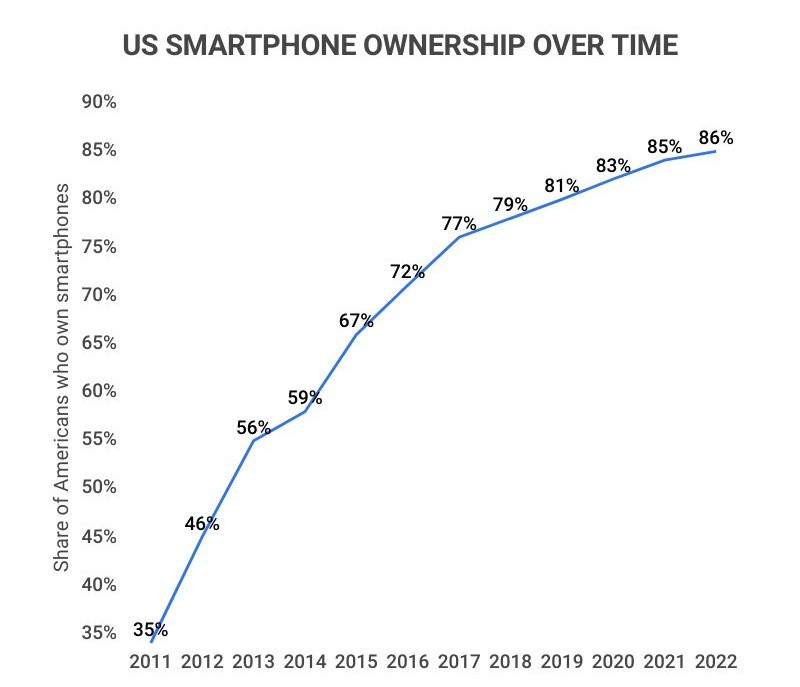
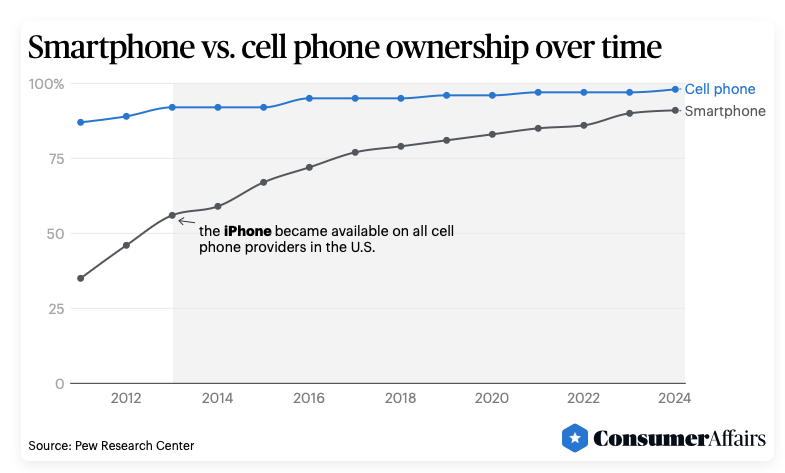
We see another jump in household broadband consumption in 2017, which we can trace to the smartphone ownership passing 77% with another big jump registered in 2020 when the 5G iPhone model was introduced. That model, along with other 5G devices, offered an even more robust network speed, richer applications, and a lower latency experience. Paired with the global pandemic, there was another leg up in household broadband consumption, and we haven’t looked back.
Here's the thing: Even though the number of U.S. internet users crossed over 90% in 2020 and reached around 93% in 2023, average monthly household broadband consumption rose 33% over that time frame. But it didn’t stop there. Per data from OpenVault, in 2024, average total usage of household broadband hit ~700 gigabytes per month.
What Does It All Mean?
While this is a quick overview, the point is that new connective technologies — dial-up, broadband, mobile — and the combination of more robust networks, devices, and applications drove data consumption higher over time, even though the growth rate for new internet users slowed. That is why when it comes to AI, we will watch both adoption and usage data across the enterprise and the consumer, but it will be usage levels that matter more.
As such, we’ll be keeping an eye on new AI developments on the consumer front, such as shopping, and in the enterprise, which are likely to include industry-specific developments to more general ones for human resources, accounting, and other back-office functions. As the number of use cases expands, it will drive another leg up in data creation and consumption, fueling what we call the virtuous circle for digital infrastructure demand.
We’ll also keep tabs on next-gen connective technologies such as 6G replacing 5G and Wi-Fi 8 eventually replacing Wi-Fi 7, which will likely foster more robust applications and greater data usage, and help keep that virtuous circle spinning.
