Charting the Markets: The Dow Offers Another Bullish Perspective
The venerable index ETF is poised to break out to new all-time highs soon.
You've reached your free article limit
You've read 0 of 1 free Pro articles.
Whether it is a change in names or composition to include more technology-related companies (Nvidia NVDA, Amazon AMZN were recently added), or simply a strong economy, the Dow Industrials are within earshot again of an all-time high, charting a course towards 45,000 and then likely 50,000 later in the year. That seems like a big move but after being up 5% so far in 2025 tacking on another 5,000 points would only bring the total return to something like 15% on the year. Heck, the Dow returned 12.9% last year in a much higher interest rate environment and with more stress on the economy from inflation.
All that said, the Dow Jones Industrial Average ETF DIA has been impressive for the first six weeks of the year, leading the way up until this past week until the Nasdaq took the top spot. Fear not though, the Industrials boast a very powerful chart with bullish indicators to back it up.
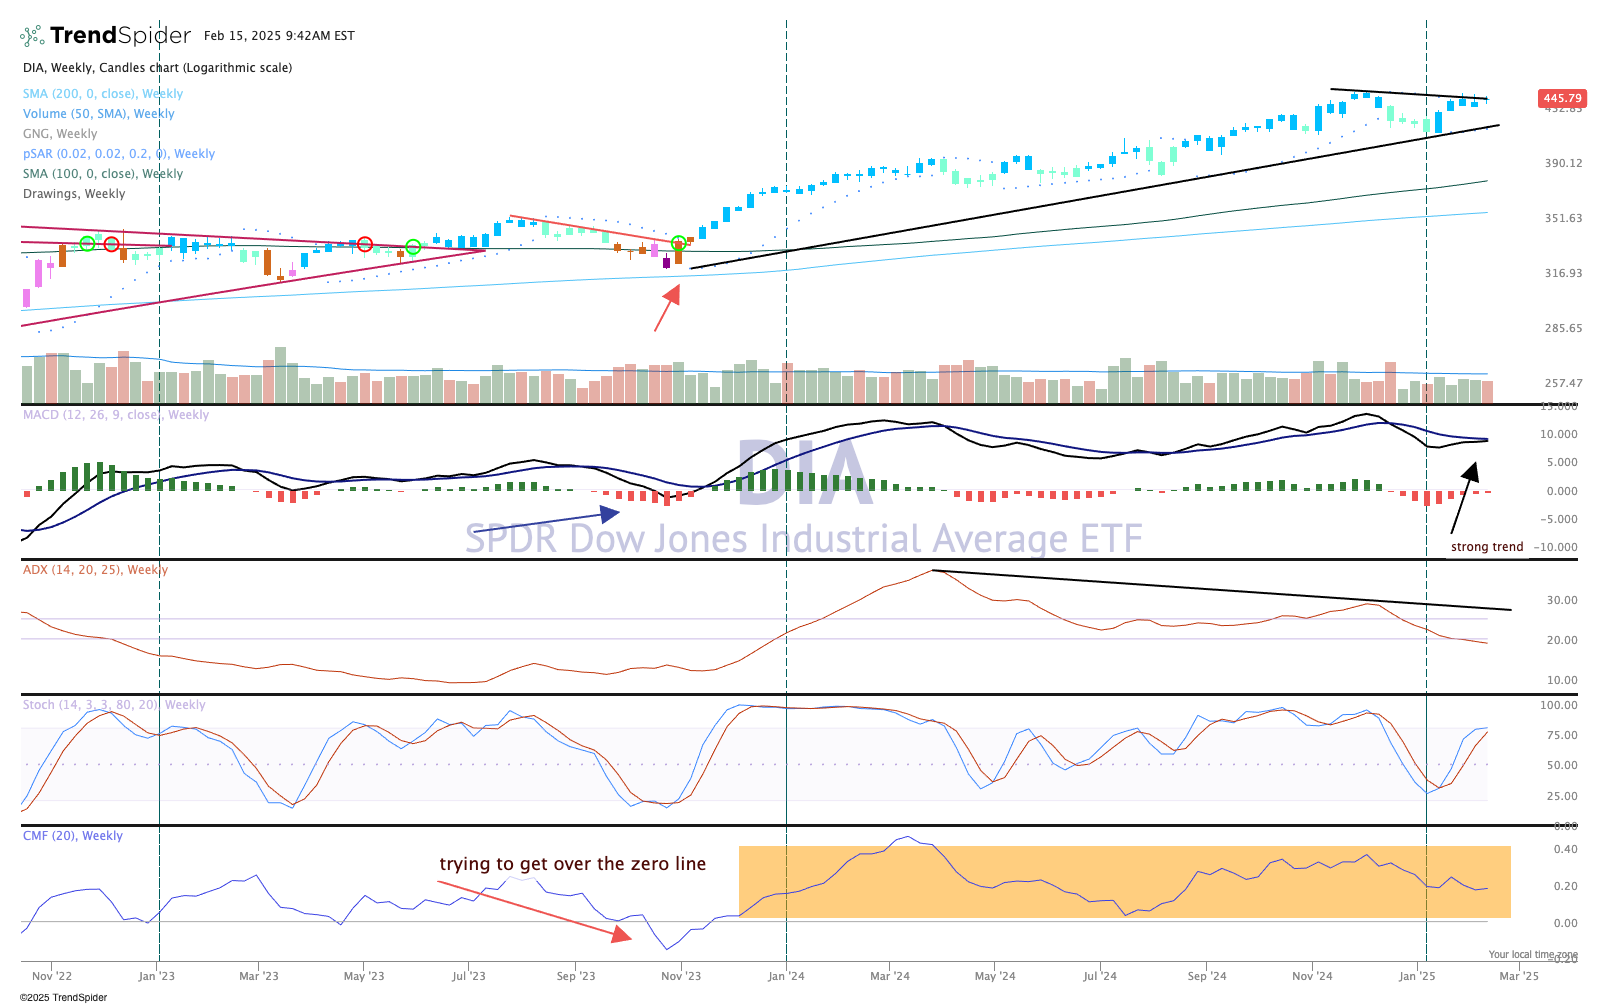
Money flow remains robust and has been bullish since late 2023. The trend in the DIA is clearly bullish: the candles on this weekly chart have been blue or teal (bullish) since late 2023. Volume trends are bullish as well, and while it appears the index has run into some resistance, the all-time highs are just 1% away from current levels, which can be achieved in a day or two.
We like the technicals here on this weekly chart and see further gains ahead albeit at a much slower pace.
