December Monthly Roundup: A Year of Ups and Downs, Volatility — And Big Profits
Let's review the month, the year and look at what could be in store for 2026.
You've reached your free article limit
You've read 0 of 1 free Pro articles.
Despite the ups and downs we experienced in 2025, not to mention a good bit of market volatility along the way, when all is said and done, the stock market and the Pro Portfolio had a very profitable year. The year included the initial uncertainty and fallout of President Trump’s tariffs, geopolitical tensions, the government shutdown, persistent inflation, and multiple pullbacks, including the late February to early April one that pulled the market and the Portfolio into negative territory.
We made several moves during the year that delivered sizable and booked gains in shares of Alphabet (GOOGL) , Microsoft (MSFT) , United Rentals (URI) , Marvell (MRVL) , Dutch Bros (BROS) , Nvidia (NVDA) , Morgan Stanley (MS) , Axon (AXON) , Vulcan Materials (VMC) , Mastercard (MA) , the VanEck Uranium Nuclear Energy ETF (NLR) and many others. As we discussed in Tuesday’s Portfolio video, we also made moves that stemmed losses that could have been much larger.
While the Portfolio’s double-digit return before dividends in 2025 isn’t anything to sneeze at, especially since it follows the 25.2% return before dividends in 2024, we will concede that we are not exactly jumping for joy at that performance. Like many others, while we can see the smart moves and the wins we garnered during the year, we tend to focus more on either what we missed, should have seen, or could have done better.
There are times when, despite all the data points lining up, the credibility of a management team can throw us a curveball, as we saw with Universal Display (OLED) in early November. But there are also times when we should have been more patient with a holding, especially when we see an extreme reaction and an uncertain environment like the one that led us to shed shares of Applied Materials (AMAT) , leaving some big money on the table.
And that’s why we keep our trading notebook handy so we can review data points, what worked and why, and lessons learned. The goal is to do our best to avoid making the same mistake down the road, while we listen to signals we collect, monitor industry and company-specific fundamentals, all the while keeping tabs on the technicals — for both the market as well as the Portfolio’s holdings.
We can comfortably share that following the data and connecting the dots has led the Portfolio to three consecutive years of double-digit gains. Following that playbook led us to stick with Alphabet (GOOGL) shares even though many fretted that AI would eat its search lunch. We started the Portfolio’s position Palantir (PLTR) during the market selloff, picking up our first two slugs of shares between $78-$84 in early March. In April, when Marvell (MRVL) shares touched the mid-$50s, we swooped in to rebuild the position after trimming it back at $116.31 at the start of the year. And so on.
Were there some positions that frustrated us? Sure, there were, and you can include Marvell in that bunch, as well as Dutch Bros (BROS) in October when they bottomed out near $45. We navigated that by following the data and heeding the technicals. When shares of American Express (AXP) fell below $260 in March, we stepped in to add more to the Portfolio. That patience and understanding of the company’s membership-driven profit stream paid off, given where AXP shares are today.
I’m sure it will come as little surprise that, like many of you, we are currently frustrated with the shares of Costco (COST) , which has continued to trend lower despite the company continuing to put up monthly sales and comp figures that leave little question that this high-quality company has continued to take wallet share from other retailers. So long as the company continues to deliver comp sales gains, we’re inclined to be patient, especially given the odds of a special dividend next year.
As we look ahead at the coming 12 months, odds are there will be some hiccups along the way. We’ll strive to use those hiccups to our advantage, especially if the market becomes oversold. At the same time, we will continue to be mindful of the market’s valuation and corresponding consensus EPS expectations, and if that means getting a bit more defensive at some point, we have our inverse ETF playbook for that.
In 2024, we started Portfolio Office Hours and began to share ripped-from-the-headlines signals for our thematic framework. We continued both in 2025, and in November, we added the EPS Diplomats model strategy. You will see each of those continue in 2026, and we may have a few new things up our sleeve.
We will continue to run the Portfolio with an open hand, answering member questions in the Forum, during Office Hours, and in Alert-specific Comment sections.
Our goal is to put capital to work in well-positioned companies that are poised to deliver superior earnings growth, buying their shares at favorable prices. As we strive toward that, we also want to help newer investors learn the ropes while also sharing critical analysis and insights that more seasoned ones can profit from.
In many ways, we are just getting started. We look forward to what’s to come and having you along for the ride.
Catching Up on the Portfolio This Month
The Portfolio made a few moves in December — both big and small ones. Starting with the smaller ones, we locked in a triple-digit gain on a slice of Morgan Stanley (MS) shares on Dec. 9. On Dec. 10, we picked up a few shares of Marvell (MRVL) following management’s strong interview, and a few days later, we added more shares of Welltower (WELL) to our holdings.
We made a much larger move on Dec. 17, when we pulled the trigger and re-jiggered the Portfolio’s chip exposure, a move we initially discussed with you on Dec. 12. That move brought an initial position in Broadcom (AVGO) , and led us to establish our initial AVGO price target of $445. We will continue to evaluate opportunities to grow our AVGO exposure, a move that may mean culling back elsewhere in our overall chip exposure or somewhere else in the Portfolio.
During the quiet week between the Christmas and New Year’s holidays, the only trades we made with the Portfolio were with the first reconstitution of the Portfolio’s EPS Diplomats model strategy. As we exited six of the initial eight holdings, we noted the basket’s significant outperformance relative to the S&P 500 in the second half of Q4 2025. On Friday, we added the six new constituents, which, like their predecessors, have a track record of significant earnings growth and prospects for more of the same over the coming quarter. If anyone would like a refresher on the EPS Diplomats strategy, you can find that here, and our initial trade for the strategy on Nov. 17 here.
The sum of those moves left the Portfolio with roughly 7% of its assets in cash as we close out the holiday week. While that offers us some room to maneuver, we will revisit consensus EPS expectations for the Portfolio’s individual stock holdings as Wall Street gets back to work next week.
Should a company’s fundamental story break down, its earnings growth prospects become challenged, or its technical setup flash a dire warning, the shares could be a source of funds for the Portfolio. As we discuss below, rising memory prices and the headwind on PC and smartphone shipments could restrain Qualcomm (QCOM) shares in H1 2026. We’ll know more as we approach the December quarter earnings season that starts with big bank earnings on Jan. 13, but really hits its stride the following week.
Stocks on our shopping list include the smaller positions in Welltower and Broadcom, and we’ll continue to monitor some of the larger position sizes to see if they cross the 4.5% position level. Should that happen, you should expect some prudent portfolio management.
This Week's Portfolio Videos
We cover a lot of ground during the week in our Daily Rundowns. If you happened to miss one or more of them, here are some helpful links:
Monday, December 29: Joining Yahoo! Finance to Talk Nvidia and Other Tech Favorites
Tuesday, December 30: Let’s Review 6 Holdings We Exited in 2025: What Went Right and Wrong
This Month’s Podcasts and Signals
Big discussions and insights are had during TheStreet Stocks & Markets Podcast, and in Signals, we share the latest news for the Pro Portfolio’s strategies. Here are some quick links to those conversations conducted over the last several weeks:
December 3: Stocks & Markets Podcast: Fighting Cancer With GT Biopharma CEO
December 6: Seasonally Picky Shoppers, Hypersonic Upgrades, More Investing News
December 10: Stocks & Markets Podcast: Getting Ready for 2026 With Freedom Capital
December 13: AI Cops & Robbers, Pizza's Out of Reach, and More Investing News
December 18: Stocks & Markets Podcast - The Market Setup and Pro Picks for 2026
December 22: Trump Makes 6G Decision, Loan Delinquencies Surge, and More Investing News
Some helpful links if you prefer to catch the podcast on the go, in the car, or wherever. Be sure to give it a like or thumbs up and leave a review if you’re so inclined. We’d appreciate it.
YouTube, Apple Podcasts, Spotify
Key Global Economic Readings
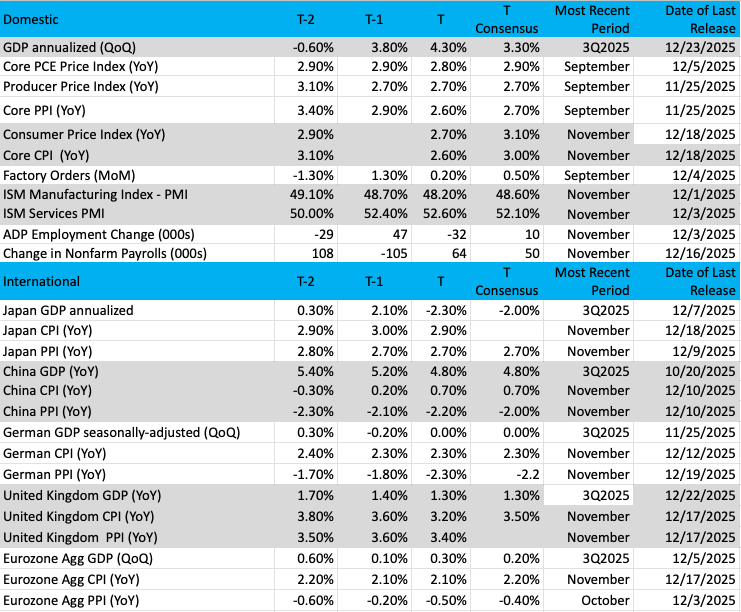
(Note: T is the most recent period, T-1 is the prior period's reading, and T-2 is two periods back, the intent being to illustrate any trends.)
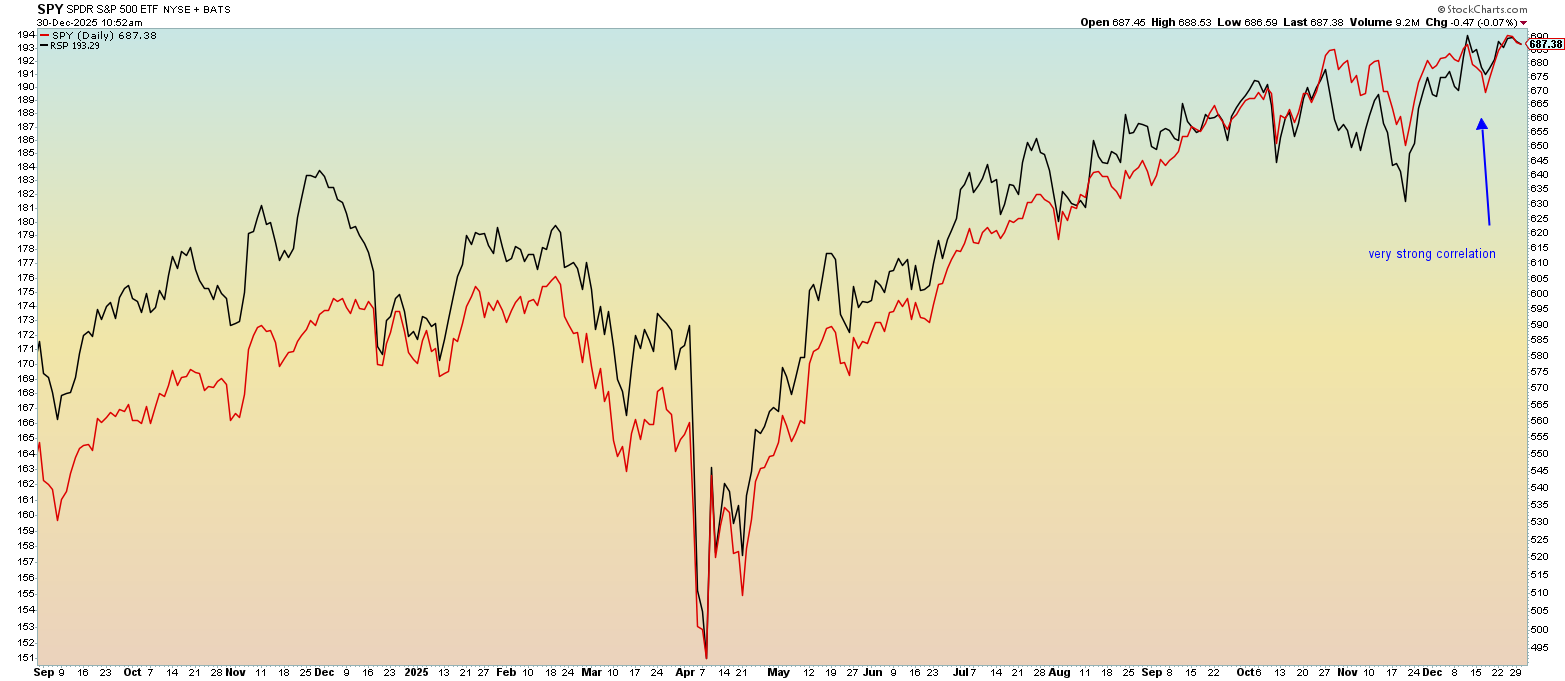
Chart of the Week: S&P 500 – Market Cap vs. Equal Weighted
Once again, we're taking a look at the S&P 500 from a weighted and equal-weighted point of view. Markets have been rising over the past few weeks, but seem to have stalled out. Perhaps traders are waiting for the new year to begin. Whatever the case, both the (SPY) and (RSP) (weighted and equal-weighted ETFs) are moving in tandem, something that is not so common, but is often bullish.
You may ask why this would be bullish? It makes sense to have both indices moving together, and this often means a bullish move is on the horizon. The SPY, which is the weighted S&P 500 index and that has strong influence from the Magnificent Seven and other mega-caps, has been congruent with the rest of the market. The RSP, which is the equal-weighted S&P 500, has been tracking the SPY perfectly.
No question the index is bullish, with higher highs and higher lows in place. That is our textbook definition of an uptrend. For 2025, the SPY is up roughly 17% while the RSP has gained about 11% for the year. The difference is likely in the excess performance of those above-mentioned Mag 7 names, which have a strong influence on the SPY. The RSP performance is terrific and is on par with its average return over the last 10 years.
Could we see more of the same in 2026? All things being equal, the answer is yes, with a friendly Fed (more rate cuts likely and QE probable), strong productivity, lower inflation, and healthy conditions, even as the job market may be slowing down. We think that returns are not going to be as robust in the year ahead, but that is simply a guess. Volatility is likely to kick up, so you just never know. Otherwise, be positioned in the highest quality names.
Other charts we shared with you this past week were:
Monday, December 29: S&P 500: S&P 500 Hit All-Time High But There's Trouble Ahead
Monday, December 29: Morgan Stanley (MS): Holding Remains Buy‑the‑Dip Candidate Even After 92% Gain
Tuesday, December 30: Dutch Bros (BROS): Here's Where It's 'Game On' for Dutch Bros
Wednesday, December 31: Labcorp (LH): All Is Quiet in the 'Lab' — For Now
The Week Ahead
After two weeks of abbreviated weeks, we get back to a normal five trading days, and given the calendar, it means we will have a full plate of economic data to chew through. Coming off the Fed’s latest policy meetings, no doubt the multiple looks at the jobs market in December will catch a fair amount of attention. As we parse those figures, we’ll complement our analysis with insights from the December PMI data, including its insights on inflation and the economy’s vibrance entering the new year.
As of now, the calendar for Fed speakers is practically nil, but that can change, so we’ll be taking a fresh look at that early next week. Because the Fed enters the blackout period on Jan. 17 for its Jan. 27-28 policy meeting, the window for those speakers is limited. For our money, we’re inclined to listen to the Fed speakers we do get once the December Employment Report is published on Jan. 9 and even more so once we have the December CPI and PPI reports on Jan. 13 and 14.
In our view, that aggregate picture should give us a better indication of what the Fed is likely to do at its January and March 2026 policy meetings. As of now, the market does not anticipate the next Fed rate cut until the April meeting. However, as we’ve often discussed, bad news for the economy tends to be good news for rate cuts. This time around, the combination that could get the Fed to do more or at least act sooner than the market expects it will, is further weakness in the jobs market, and inflation data falling further back to Earth.
Here's a closer look at the economic data coming at us next week:
U.S.
Monday, January 5
ISM Manufacturing Index – December (10:00 AM ET)
Tuesday, January 6
S&P Global Services PMI Report (Final) – December (9:45 AM ET)
Wednesday, January 7
MBA Mortgage Applications Index – Weekly (7:00 AM ET)
ADP Employment Change Report – December (8:15 AM ET)
ISM Non-Manufacturing PMI Report – December (10:00 AM ET)
Factory Orders – November (10:00 AM ET)
JOLTs – Job Openings & Quits Report – November (10:00 AM ET)
Business Inventories – November (10:00 AM ET)
EIA Crude Oil Inventories – Weekly (10:30 AM ET)
Thursday, January 8
Challenger Job Cuts Report – December (7:30 AM ET)
Initial & Continuing Jobless Claims – Weekly (8:30 AM ET)
Productivity & Unit Labor Cost – Q3 2025 (8:30 AM ET)
EIA Natural Gas Inventories – Weekly (10:30 AM ET)
Consumer Credit – November (3 PM ET)
Friday, January 9
Employment Report – December (8:30 AM ET)
Housing Starts & Building Permits – September, October (8:30 AM ET)
University of Michigan Consumer Sentiment Index (Prelim) – January (10:00 AM ET)
International
Monday, January 5
Japan: S&P Global Manufacturing – December
China: RatingDog Services PMI – December
UK: Bank of England Consumer Credit - November
Tuesday, January 6
Eurozone: HCOB Services PMI (Final) – December
UK: S&P Global Services PMI (Final) – December
Germany: Inflation Rate (Prelim) - December
Wednesday, January 6
Japan: S&P Global Services PMI (Final) – December
Germany: Retail Sales – November
Eurozone: Inflation Rate (Flash) - December
Thursday, January 7
Eurozone: Unemployment Rate, Producer Price Index – November
Friday, January 8
Japan: Leading Economic Index (Prelim) – November
Eurozone: Retail Sales – November
As we noted above, next week’s news flow will skew more toward economic data than earnings. While we parse the ones we do get, we will continue to watch for pre-announcements, both good and bad, for the December quarter, connecting them back to the Pro Portfolio as needed. We will also keep our eyes open for December revenue reports from Taiwan Semiconductor (TSM) , Foxconn, and our own Costco (COST) .
Next week also brings CES 2026, which runs from June 6-9 and includes keynote presentations from Vivendi, Siemens AG, Caterpillar (CAT) , Advanced Micro Devices (AMD) , Lenovo, and Oura. Odds are we will see a blizzard of press releases from companies presenting at the event, as well as those announcing new products and services. Likely topics will include AI, quantum computing, electric vehicles, digital infrastructure, and IoT. As such, we will be tracking what’s announced rather closely, tying what is said back to our holdings.
Here's a closer look at the earnings reports coming at us next week:
Wednesday, January 7
Open: Albertsons (ACI), Cal-Maine- Foods (CALM), MSC Industrial (MSM)
Close: Applied Digital (APLD), Constellation Brands (STZ), Jefferies (JEF), PriceSmart (PMST)
Thursday, January 8
Open: Acuity (AYI), Helen of Troy (HELE), Simply Good Foods (SMPL)
Close: Greenbrier (GBX), WD-40 (WDFC)
Portfolio Investor Resource Guide
· Economic Data: Here's a List of Links to the Key Economic Data We Closely Watch
· Investing Terminology: 16 Key Terms Club Members Should Know
· 10-Ks: Want to Know About a Stock? Read the Company's Reports
· 10-Qs: Unlock the Numbers and Key Information Behind Your Stock With the 10-Q
· Income Statement: Our Cheat Sheet to Understanding This Financial Document
· Balance Sheet, Cash Flow Statements, and Dividends: How to Know If a Company Is Off-Kilter? Read Its Balance Sheet
· Valuation Metrics: Everyone Wants a Value. Here's How Investors Can Find
· Thematic Investing 101 Webinar
· Like the Benefits of ETFs? Let’s Talk About Models
The Portfolio Ratings System
1 - Buy Now (BN): Stocks that look compelling to buy right now.
2 - Stockpile (SP): Positions we would add to on pullbacks or a successful test of technical support levels.
3 - Holding Pattern (HP): Stocks we are holding as we wait for a fresh catalyst to make our next move.
4 - Sell (S): Positions we intend to exit.
ONES
Amazon AMZN; $230.82; 881 shares; 3.70%; Sector: Consumer Discretionary
UPDATE: Shares of Amazon (AMZN) drifted sideways in December, leaving them up more than 5% in Q4 2025, which was more than enough to make them an outperformer for the period. That sideways performance came in the face of favorable consumer spending metrics for the holiday shopping season, complete with confirmation that shoppers leaned into digital shopping. Amazon also held its re:Invent 2025 event, during which Amazon Web Services (AWS) CEO Matt Garman’s core message centered on AWS being ready for the enterprise to scale AI adoption and usage. Garman also reminded the audience that AWS is now a more than $130 billion run-rate business, growing 20% year over year. Let’s remember that, like other Big Tech companies, Amazon is ramping its capex next year to bring on additional AWS capacity to meet rising demand. Exiting the September quarter, AWS backlog stood at $200 billion, and that figure has only moved higher based on wins announced so far in Q4. As Amazon digests that oncoming AWS capacity and benefits from its internal AI adoption, we could see margins at AWS move higher. Because AWS drives the bulk of Amazon’s profits, that would translate into incrementally higher EPS. Should that unfold as expected, we’ll revisit our $310 price target. We also see Amazon’s higher-margin advertising business flourishing during the holiday shopping season and into 2026, especially as it continues to flex advertising on Prime Video. Outside of the company’s core businesses, per recent 13F-HR filings, Amazon holds a stake of 158.36 million shares in Rivian, 225,428 shares in Marvell, as well as positions in other companies. In mid-December, Amazon was reportedly in talks with OpenAI for an investment of around $10 billion, a move that would likely include OpenAI using AWS and Amazon’s Trainium chips, a positive for our Marvell and Broadcom shares. We will be following that as well as monitoring developments for Amazon’s autonomous vehicle effort, better known as Zoox.
December Price Change: -1.0%; Yield: 0.00%
INVESTMENT THESIS: We believe that upside will result from Amazon's continued e-commerce dominance, AWS's continued leadership in the public cloud space, and the ongoing growth of the company's advertising revenue stream, which feeds off Amazon's e-commerce business. Additionally, we think profitability will continue to improve as AWS and advertising account for a larger portion of total sales, as both these segments sport higher margins than the eCommerce operation. While we believe the increasing share of the revenue from these higher-margin businesses will be key to driving profitability longer-term, we think margins on eCommerce stand to improve as the company's infrastructure is further built out and economies of scale further kick in. The embedded call option is that management is always looking to enter a new space and generate new revenue streams.
Target Price: Reiterate $310; Rating: One
Panic Point: $210
RISKS: High valuation exposes the stock to volatile swings, e-commerce has exposure to slower consumer spending and competition, potential headwinds resulting from new e-commerce regulation in India, and management is not scared to invest aggressively for growth, which can at times cause volatile reactions as near-term concerns arise relating to the impact on margins.
Arista Networks ANET; $131.03; 1,325 shares; 3.16%; Sector: Technology
UPDATE: We started our position in Arista Networks (ANET) in October and used the November pullback to scale further into the shares. That turned out to be a timely move given the subsequent rebound in December. While ANET shares are below our cost basis as we close out 2025, several developments in December keep us bullish on the demand for network infrastructure in the coming quarters. Those data points include OpenAI’s “The State of Enterprise AI” 2025 report, rising AI revenue at Adobe, the U.S. Department of Transportation deploying Salesforce’s Agent AI platform, and Micron sharing a vibrant outlook for AI server unit growth in 2026. We continue to think AI adoption and usage across the enterprise, consumers, and government entities will drive network capacity higher, as will the use of AI agents and AI-generated video. As those adoption and usage rates rise, ensuing capacity issues should foster additional capital spending on networks and digital infrastructure. We aim to capture that, as well as the AI and data center buildout, by being shareholders in Arista. When the company reports its December-quarter results, we will be closely tracking developments for its deferred revenue, which rose to $4.7 billion exiting the September quarter, from $4.1 billion in the prior one. Given the AI and data center announcements made during the quarter from hyperscalers and others, a flat deferred revenue figure for Q3 2025 would be disappointing. Catalysts that could lead us to raise our price target include stronger-than-expected AI and data-center capital spending efforts from key Arista customers, Microsoft, and Meta, as well as others in the AI and data-center space.
December Price Change: 0.3%; Yield: 0.00%
INVESTMENT THESIS: Arista Networks engages in the development, marketing, and sale of data-driven, client-to-cloud networking solutions for AI, data center, campus, and routing environments in the Americas, Europe, the Middle East, Africa, and the Asia-Pacific. Its cloud networking solutions consist of Extensible Operating System (EOS), a publish-subscribe state-sharing networking operating system offered in combination with a set of network applications. The company offers data center, cloud, and AI networking, cognitive adjacencies, and cognitive network software and services. It also provides post-contract customer support services, such as technical support, hardware repair, and replacement parts beyond standard warranty, bug fixes, patches, and upgrade services. The company serves a range of industries comprising internet companies, cloud service providers, financial services organizations, government agencies, media and entertainment, healthcare, oil and gas, education, manufacturing, industrial, and others. Two the Arista’s largest customers in the last few years are two Portfolio holdings you’ll quickly recognize — Microsoft and Meta. Per Arista’s 10-K filings, both Meta and Microsoft each account for more than 10% of revenue. Other named customers include Amazon’s AWS, Google Cloud, Anthropic, Canva, SAP, Shopify, Apple, Oracle, Bank of America, and Accenture.
Target Price: $180; Rating: One
Panic Point: $110
RISKS: Economic, customer, supply chain, and competition risks.
Axon Enterprise AXON; $567.93; 377 shares; 3.90%; Sector: Aerospace & Defense
UPDATE: When we added Axon (AXON) back to the Portfolio, we recognized that the higher beta associated with the shares can exacerbate their movements in a volatile market (as evidenced in recent weeks). We saw that unfold in November to the downside as AXON fell to a low near $519 before rebounding to close the month near $541. In early November, we used big gains from our exit of Vulcan Materials to pick up additional AXON shares following the company’s latest quarterly results. Annual recurring revenue climbed 41%, year over year, to $1.3 billion, while net revenue retention held steady at 124%. More importantly, future contracted bookings climbed to $11.4 billion, a nice step up from $10.7 billion exiting the June quarter, and that led Axon to nudge its full-year revenue outlook to approximately $2.74 billion, up from a previous range of $2.65 billion-$2.73 billion. In December, AXON shares rebounded more than 5%, helping erase some of their Q4 2025 drag on the Portfolio. For us, the Axon story continues to be centered on the mix shift toward the higher-margin, recurring revenue services business, as well as continued growth for its hardware business in federal, corporate, and international markets. The global public safety and security market is expected to grow from an estimated $581.9 billion in 2025 to approximately $1.63 trillion by 2034, led by technology and software segments. This includes AI-powered analytics and video surveillance systems to detect criminal activities and real-time data analysis tools for rapid decision-making and enhanced emergency response. We see Axon well-positioned to capitalize on that multi-year tailwind, which is augmented by the police shortage pain point.
December Price Change: 5.1%; Yield: 0.00%
INVESTMENT THESIS: Axon Enterprise develops, manufactures, and sells conducted energy devices and cloud-based digital evidence management software designed for use by law enforcement, corrections, military forces, private security personnel, and private individuals for personal defense. The company operates in two segments: Taser (recently renamed Connected Devices) and Software & Sensors (recently renamed Software & Services). Taser develops and sells CEDs used for protecting users and virtual reality training. Software & Sensors manufactures fully integrated hardware and cloud-based software solutions such as body cameras, automated license plate reading, and digital evidence management systems. Axon delivers its products worldwide and gets most of its revenue from the United States. According to Mordor Intelligence, the wearable and body-worn cameras market on its own was valued at $1.62 billion in 2020 and is expected to reach $424.63 billion by 2026. Public safety organizations are increasingly adopting cloud solutions, leading to significant spending in this area. The digital spending in public safety is projected to reach $201 billion by 2027.
Target Price: Reiterate $800; Rating: One
Panic Point: $500
RISKS: Manufacturing and supply chain, competitive factors, government regulation, and technology change.
Costco Wholesale COST; $862.34; 237 shares; 3.72%; Sector: Consumer Staples
UPDATE: Costco (COST) has been a frustrating position for the Portfolio over the last few months as the shares have leaked slowly like air from a balloon despite the company continuing to put up impressive comp sales on top of difficulty year-ago comparisons. We saw that comp sales strength in early December, when Costco reported its 12-week comp sales through November 23 were up 8.2% year over year. While that figure is impressive compared to numbers being put up by other retailers, what makes that 8.2% figure an even greater standout to us is that it laps the 7.5% net sales increase posted in the year-ago quarter and 6.1% in the same quarter in 2023. Operating income for the quarter climbed just over 12%, compared to the year-ago quarter, due to better merchandise margins, but really due to a 14.0% year-over-year gain in those high-margin membership fees. Driving that revenue was the continued gain in paid memberships and executive memberships, which rose 4 million and 3.3 million, respectively, compared to the year-ago quarter. We’ve seen a steady increase in both over the last several quarters. And 12% operating income growth compared to 8.3% total revenue growth means margin expansion. To be clear, those membership gains are eclipsing the growth in warehouse locations, which ended the November 2025 quarter at 923 compared to 897 exiting the year-ago quarter. This tells us Costco’s value proposition continues to woo consumers — as do the consistent membership renewal rates, at 90% globally and more than 92% in the U.S. What the cumulative data points tell us is that Costco continues to hum and consumers continue to respond. When we’ve been in frustrating situations like this in the past, we’ve leaned on data to determine if we should continue to hold a company’s shares. So far, there is little question about Costco winning consumer wallet share, but if comp sales or membership figures flat line, which would give us a reason to reconsider owning the name. With management targeting opening 30 more warehouse locations in the coming few quarters and more after that, the odds of that happening are low. But we will follow the data and make decisions based on what it tells us. Costco will report its December sales on January 8. We continue to favor its differentiated membership-driven business model, one that sets Costco apart from other retailers.
December Price Change: -5.6%; Yield: 0.60%
INVESTMENT THESIS: We like Costco's long-term prospects, driven by a club-based operating model that focuses on volumes, not margins, and therefore offers its customers a value proposition of everyday low prices. The strength of this model has created an incredibly loyal customer base with low churn and continued share gains in both brick-and-mortar and e-commerce. This is a global concept, evidenced by the strength of sales both in the U.S. and abroad, which includes an emerging China opportunity. We see the company's membership model as a key differentiator versus other retailers, and its plans to open additional warehouse locations in the coming quarters should drive retail volumes and the higher-margin membership fee income as well. We also appreciate management's approach to capital returns and their willingness to return cash.
Target Price: Reiterate $1,100; Rating: One
Panic Point: $825
RISKS: Inability to pass through higher costs, fuel prices, weaker consumer, and membership churn.
Eaton Corp. ETN; $318.51; 593 shares; 3.44%; Sector: Industrials
UPDATE: We’re not going to sugarcoat it, Eaton (ETN) shares were a double-digit drag on the Portfolio during Q4 2025 as concerns over the AI trade trumped the growing number of forecasts identifying the energy pain point we continually discuss with you. Those signals, as well as recent municipal power outages, serve as sharp reminders of the need to update the domestic power grid. Deloitte sees U.S. power sector investments reaching $1.4 trillion between 2025 and 2030. This six-year outlay is equivalent to the total capital expenditure of the U.S. power sector over the preceding 12 years, underscoring the challenge and the opportunity that lies ahead. The ICF projects significant increases in U.S. electricity demand over the next 25 years, with demand rising 25% by 2030 and 78% by 2050. In the near term, the U.S. Energy Information Administration (EIA) has raised its projections for electricity consumption in the country, citing a spike in power demand from commercial sectors — especially data centers — as a key driver. In its latest update of the Short-Term Energy Outlook (STEO), the EIA said it expects total U.S. electricity demand to rise from 4,097 billion kilowatt-hours (kWh) last year to 4,193 billion kWh in 2025, and 4,283 billion kWh in 2026. Data points like those, as well as rising electric utility capital spending, keep us patient with ETN shares for the long haul. Current consensus estimates call for Eaton to grow its EPS by ~13% year over year in 2026, but 2026 electric utility capital spending plans will reveal how conservative those calls are. When Eaton reports its December-quarter results, we’ll be tracking relevant backlog figures, but we’ll also be interested in what is said about the Boyd Thermal acquisition and how that should bolster its data center positioning.
December Price Change: -7.9%; Yield: 1.31%
INVESTMENT THESIS: Eaton is an intelligent power management company that makes products for data center, utilities, industrial, commercial, machine building, residential, aerospace, and mobility markets. That business is positioned to capitalize on the mega trends of electrification, energy transition, and digitalization. We see Eaton helping address the power pain point created by data center, EV charging infrastructure, and other drivers of electricity demand. Research estimates that data center power demand will grow 160% by 2030, accounting for 3% to 4% of global power, up from 1% to 2% today. Data centers will use 8% of U.S. power by 2030, compared with 3% in 2022.
Target Price: Reiterate $420; Rating: One
Panic Point: $325
RISKS: Raw material costs, labor costs, end market volatility, and government legislation.
Marvell Technology MRVL; $84.98; 2,145 shares; 3.32%; Sector: Technology
UPDATE: Marvell Technology (MRVL) shares underperformed the broader market in December, but gains earlier in the quarter resulted in the Q42025 performance ending in the black. We continue to see Marvell benefiting from multiple tailwinds, including AI and data-center spending, its ramping custom AI silicon business, and an accelerating rebound in its enterprise networking and carrier infrastructure business as AI adoption and usage rates climb further. In response to Marvell’s October-quarter results, we increased our price target to $140 from $125. Looking to the company’s fiscal 2027, which ends in January 2027, Marvell’s initial guidance calls for Data Center segment revenue to grow by more than 25% and the Communications & Other revenue to be up 10%. Some back-of-the-napkin math implies around $10 billion in revenue during fiscal 2027, compared to the $5.8 billion delivered in fiscal 2025. Fueling that expected increase is the quickly growing interconnect business, which should grow faster than overall cloud capital spending next year, and the continued ramp in Marvell’s custom AI silicon business, which on its own should be up ~20% in fiscal 2027. Marvell signaled that, based on its program wins, it already sees its Data Center revenue growth accelerating above fiscal 2027’s 25% growth target. For a company that typically guides one quarter at a time, Marvell is sharing far more than usual, an indication that suggests its program visibility has improved. Alongside that quarterly report, Marvell announced its acquisition of Celestial AI, the creator of Photonic Fabric, an optical interconnect technology platform for AI computing systems that is expected to accelerate Marvell’s connectivity strategy for next-generation AI and cloud data centers. Based on Celestial's current customer line-up and program wins, Marvell shared that it sees meaningful revenue contributions from Celestial AI beginning in the second half of fiscal 2028, reaching a $500 million annualized run rate in the fourth quarter of fiscal 2028, doubling to a $1 billion run rate by the fourth quarter of fiscal 2029. Subsequent to Marvell’s October earnings report, CEO Matt Murphy came out swinging on December 10 as he reiterated the company’s forward-facing comments. As part of our reshuffling of the Portfolio’s chip exposure, a move that added Broadcom to the Portfolio, we trimmed back our exposure to MRVL shares. Despite that move, we continue to rate MRVL a One.
December Price Change: -4.9%; Yield: 0.28%
INVESTMENT THESIS: Marvell is a fabless supplier of high-performance standard and semi-custom infrastructure semiconductor solutions. These solutions power the data economy, enabling the data center, carrier infrastructure, enterprise networking, consumer, and automotive/industrial end markets. With roughly 75% to 80% of Marvell's revenue stream tied to digital infrastructure, we see it continuing to benefit from rising content consumption and creation. Pointing to that rising demand that necessitates network densification and the build of digital infrastructure, Ericsson sees global monthly average usage per smartphone reach 46 gigabytes (GB) by the end of 2028, versus 19 GB in 2023 and 15 GB in 2022.
Target Price: Reiterate $140; Rating: One
Panic Point: $75
RISKS: Technology risk, customer risk, competition risk, reliance on manufacturing partners, and supply chain constraints.
Meta Platforms META; $660.09; 337 shares; 4.05%; Sector: Communication Services
UPDATE: Shares of Meta (META) moved up nicely in December, but remained a drag on the Portfolio during Q4 2025. Despite that setback, META shares closed 2025 up low double digits. As we move into 2026, we continue to see Meta benefiting from the continued shift to digital advertising as it expands its reach across all of its key platforms. As we saw in the September 2025 quarter, advertising accounts for ~99% of Meta’s revenue stream. Internal adoption of AI should help drive improved profitability over the long term as those advertising volumes rise. Helping reaffirm that line of thinking, new data from Photoshelter found that 95% of marketers lean on social platforms to drive marketing outcomes, with two-thirds saying it is the primary channel that delivers results for their organization. As we think about that, let’s also consider how Meta is using AI to improve the profitability of its advertising business. On that point, in December reports indicated Meta may unveil a new image- and video-focused AI model referred to as “Mango,” as well as another model referred to as “Avocado” in the first half of 2026. Given the growing influence of video on digital advertising, we look forward to hearing more on this from Meta in the coming months. Bottom-line, greater monetization across more platforms that reach the company’s total daily active user base of 3.54 billion is a combination for higher revenue and eventually higher margins as opex levels return to more normalized levels as Meta’s AI investments mature. As part of our tracking of AI adoption and usage rates, we will monitor Meta’s progress in not only the consumer and enterprise markets, but also the enterprise and government ones, following Meta’s AI models becoming a part of the U.S. General Services Administration (GSA) OneGov initiative in September. This week, Meta announced it would acquire Singapore-based AI startup Manus, which makes an artificial intelligence agent that it sells to small and medium-sized businesses. Meta plans to continue operating and selling the Manus service while also integrating it into Meta’s product ecosystem, including Meta AI. We recognize some will remain focused on Meta’s capital spending levels and its wearables efforts, and we will too, but our larger focus will be on the company’s ability to monetize advertising on its platforms and leverage AI to drive margins, cash flow, and EPS higher.
December Price Change: 1.9%; Yield: 0.32%
INVESTMENT THESIS: Meta segments its business between Family of App Products, which includes Facebook, Instagram, Messenger, Threads, and WhatsApp, and Reality Labs Products, which includes its metaverse and investments and future product R&D. Family of Apps accounts for about 99% of the company's revenue and 100% of the company's operating profits. Substantially all of Meta’s revenue is currently generated from advertising on Facebook and Instagram. Family daily active people (DAP) were 3.54 billion on average for the September 2025 quarter. Meta expects to spend $70 billion to $72 billion on capex in 2025, a significant increase year over year, with most of this spending focused on AI infrastructure and initiatives. Meta is positioned to benefit from the ongoing shift toward digital advertising and the adoption of AI across its product offerings. We recognize Meta is ramping up capital spending as part of the current AI arms race, but we see that as an investment that should drive productivity in its core advertising business. As the company harvests that investment, we could see a step up in margins, much like we saw in 2023.
Target Price: $850; Rating: One
Panic Point: $560
RISKS: Ability to add and retain users and user engagement; marketing spend; new products or changes to existing ones; competitive risk, geopolitical risk.
Nvidia Corp. NVDA; $186.50; 970 shares; 3.30%; Sector: Technology
UPDATE: While shares of Nvidia (NVDA) finished the year on a positive note, their volatile performance during October and November led them to finish Q4 2025 up modestly. That performance masks the more than 40% gain registered by NVDA during 2025, easily more than double the S&P 500. In our view, the Q4 2025 performance by NVDA reflects the battleground that emerged between concerns over the AI trade and rising capital spending levels on AI and data centers. During the quarter, we discussed why our north star will be AI adoption and usage figures for the enterprise, consumers, and other entities. After that Alert, comments made during Amazon’s 2025re: Invent event, in OpenAI’s “The State of Enterprise AI” 2025 report, Disney’s agreement with OpenAI for the use of its characters on its Sora short-form video platform, and others point to continued AI adoption and growing usage across those segments. Earlier this month, we discussed how the usage of AI-generated video could drive data center and digital infrastructure capacity utilization levels higher, fostering the need for even more capacity. We continue to think there will be further announcements as others push into this front, which should be constructive for the Portfolio’s holdings. Our thinking remains that as adoption and especially that usage increase, it will drive demand for AI and data-center capacity as well as other aspects of digital infrastructure. During the company’s late November earnings call, CEO Jensen Huang said the company has visibility into $0.5 trillion in chip revenue from “the start of this year through the end of calendar year 2026." Jensen also reiterated his bullish stance on the buildout of AI infrastructure, which he sees reaching $3 trillion $4 trillion on an annual basis by the end of the decade. Measured against where we see current AI adoption and usage levels and Dell’s record backlog, we agree with that assessment on a directional basis, and that keeps us bullish on NVDA’s prospects. In late December, Nvidia announced its largest acquisition to date, spending $20 billion in cash to acquire AI chip startup company Groq. As we explained in our note about the move, we see it as Nvidia using its balance sheet and cash generation to simultaneously extend its competitive position while also taking a potential competitor off the board. Given the price tag, however, we will be very interested to hear what Nvidia says about cross-marketing and revenue generation synergies to cost reductions, and margin enhancers as it discusses integration plans. With that in mind, we will be on the lookout for what is said during Huang’s CES Keynote on January 5, which will no doubt include a sweeping, multi-year vision for AI. Other upcoming data points we’ll be watching include December revenue reports from Taiwan Semiconductor and Foxconn, and other indicators of AI adoption. We’ll also be listening closely during December-quarter earnings season for what is said about AI adoption and usage in 2025 and what’s expected in 2026. Based on what we learn, we will revisit our NVDA price target as needed.
December Price Change: 5.4%; Yield: 0.02%
INVESTMENT THESIS: Nvidia is well-positioned to benefit from ramping AI and data center spending. The company pioneered accelerated computing to help solve the most challenging computational problems. Nvidia is now a full-stack computing infrastructure company with data-center-scale offerings that are reshaping the industry. The company's full stack includes the foundational CUDA programming model that runs on all Nvidia GPUs, as well as hundreds of domain-specific software libraries, software development kits, or SDKs, and Application Programming Interfaces, or APIs. This deep and broad software stack accelerates the performance and eases the deployment of Nvidia accelerated computing for computationally intensive workloads such as artificial intelligence, model training and inference, data analytics, scientific computing, and 3D graphics, with vertical-specific optimizations to address industries ranging from healthcare and telecom to automotive and manufacturing. Nvidia reports in two business segments: Compute & Networking and Graphics. The Compute & Networking segment (78% of revenue, 85% of operating income) is comprised of Data Center accelerated computing platforms and end-to-end networking platforms, including Quantum for InfiniBand and Spectrum for Ethernet; NVIDIA DRIVE automated-driving platform and automotive development agreements; Jetson robotics and other embedded platforms; Nvidia AI Enterprise and other software; and DGX Cloud software and services. The Graphics segment (22% of revenue, 15% of operating income) includes GeForce GPUs for gaming and PCs, the GeForce NOW game streaming service and related infrastructure; Quadro/NVIDIA RTX GPUs for enterprise workstation graphics; virtual GPU, or vGPU, software for cloud-based visual and virtual computing; automotive platforms for infotainment systems; and Omniverse Enterprise software for building and operating metaverse and 3D internet applications.
Target Price: $250; Rating One
Panic Point: $160
RISKS: Market and interest rate risk, credit risk, country risk, and operational risk, including cybersecurity.
Palantir Technologies PLTR; $177.75; 1,120 shares; 3.63%; Sector: Financial Services
UPDATE: Coming off the cumulative July-October 2025 move of more than 47% in Palantir (PLTR) shares, expectations were running extremely high for the company’s September-quarter earnings report. What we saw in Palantir’s report and guidance, which was a mixture of customer-count growth, rising contract values, and improving margins, kept us bullish on the company’s prospects and further upside in the shares despite the 16% move lower in November. Our focus in that report was the significant jump in Palantir’s total remaining deal value to $8.6 billion and remaining performance obligations to $2.6 billion exiting the September quarter. Subsequent to that report, we continued to receive positive data points on rising AI adoption and usage levels in the enterprise and government entities. That helped PLTR shares chug higher in December, leading the shares to close out a triple-digit gain for 2025. The findings of Cisco’s 2025 Global AI Readiness Index, which shows only one-third of organizations feel their IT infrastructure can accommodate the needs of their planned AI projects, suggest there is ample room to go in enterprise AI adoption. Meanwhile, comments from Accenture and IBM about data silos in the enterprise speak to one of Palantir’s value propositions. That keeps us bullish on Palantir’s prospects and shares. Palantir also stands to benefit from AI agent adoption, something we discussed this week as part of Meta’s acquisition of Manus. We want to remain shareholders of Palantir and look to benefit from the rising AI adoption levels as the company recognizes incremental operational leverage that should drive margins and EPS higher. With that in mind, over the last 60 days, consensus 2025 and 2026 EPS figures for Palantir have risen to $0.72 and $1.01 from $0.65 and $0.86, respectively. Simple math reveals those revisions contain a far quicker rate of EPS growth compared to the prior figures.
December Price Change: 5.5%; Yield: 0.00%
INVESTMENT THESIS: Palantir Technologies specializes in big data analytics and builds software platforms that help organizations integrate, analyze, and make sense of vast amounts of data for both commercial and government clients. While much has been made about the company’s exposure to the federal government, its software is used across 90 industries, and the larger global government sector accounted for 55% of revenue last year. The balance was from the commercial sector. Exiting Q3 2025, Palantir’s Commercial remaining deal value (RDV) stood at $3.63 billion, up from $1.79 billion exiting 2024. We will continue to monitor Palantir’s RDV and deferred revenue metrics, but in our view, key items to watch will be the continued diversification of its customer base across industries and increasing revenue per customer. Both have made considerable progress so far in 2025, with Commercial revenue expected to account for 33% of total revenue this year, up from 24.5% in 2024. Because we are still in the relatively early innings of AI adoption, we are inclined to be long-term owners of PLTR shares.
Target Price: $220; Rating: One
Panic Point: $150
RISKS: Economic and IT budget spending risk, technology risk, competition and competitive pressures, and customer acquisition risk.
ServiceNow NOW; $153.19; 1,225 shares; 3.42%; Sector: Technology
UPDATE: Along with other stocks tied to the larger AI trade, shares of ServiceNow (NOW) moved sharply lower in November but rebounded in the first half of December. That move was on the heels of data from OpenAI and Accenture that point to rising adoption of AI in the enterprise. As we noted in our note, one headwind for enterprise adoption is siloed data across various workflows, a development that favors ServiceNow’s position in IT, employee, and customer workflows. That bounce was cut short when headlines speculated ServiceNow was likely to scoop up cybersecurity company Armis, which serves more than 40% of Fortune 100 companies, with notable customer segments including healthcare, financial services, and defense. The speculated price tag was $7 billion, but just before the Christmas holiday, ServiceNow announced it acquired Armis for $7.75 billion in cash. While we are not thrilled with the price, given the $340 million in annual recurring revenue at Armis, ServiceNow CEO Bill McDermott said that revenue is growing at around 50% year over year, and Armis will more than triple its market opportunity for security and risk solutions. Because this is a large acquisition for ServiceNow, we are very interested to hear much more about integration plans and related synergies, and what both mean for ServiceNow’s revenue growth and margin prospects. We suspect that leaning into cybersecurity is a positive move and one that will bolster ServiceNow’s position against SAP, Salesforce, and others. We should start to get some answers when ServiceNow reports its December-quarter results in the coming weeks. As we get them, we’ll revisit our rating and our price target as needed.
December Price Change: -5.7%; Yield: 0.00%
INVESTMENT THESIS: The addition of ServiceNow adds exposure to the enterprise as it deploys AI-enabled solutions across its enterprise workflow platform. The company’s “Now Platform” is a cloud-based solution with embedded AI and machine learning (ML) capabilities that help unify and digitize workflows, driving productivity. At the heart of it, the company’s platform automates workflows across an entire enterprise by connecting disparate departments, systems, and silos in a seamless way to unlock productivity. ServiceNow counts more than 8,100 global customers, including 85% of the Fortune 500, with 97% of its revenue from subscriptions that have notched a 98% renewal rate. During the March 2025 quarter, ServiceNow also announced plans to acquire Moveworks, which offers front-end AI assistant and enterprise search technology, and Logik.ai, which provides AI-powered, and composable configure, price, and quote solutions for sales teams. We see these moves augmenting its offering and helping pave the way for further adoption of AI and subscription-based revenue.
Target Price: Reiterate $240; Rating: One
Panic Point: $150
RISKS: Industry and economic risk, competition and competitive pressures, and acquisition risk.
SuRo Capital SSSS; $9.44; 22,115 shares; 3.80%; Sector: Financial Services
UPDATE: Shares of SuRo Capital (SSSS) were a positive force for the Portfolio given their superior move in December compared to the S&P 500. The same goes for Q4 2025, where their share price return of ~5% was complemented by the December 5 dividend payment of $0.25 per share. SuRo did not declare a special dividend before the end of 2025, given the Q4 2025 slide in CoreWeave CRWV shares, but we would rather see the management team patiently wait and execute its monetization strategies than leave gains on the table. While SSSS shares are likely to move in the near-term with CRWV shares, we estimate SuRo’s stake in CRWV shares accounts for ~12% of its current investment portfolio. That same portfolio also includes the company’s stake in OpenAI, Canva, Whoop, Plaid, Liquid Death, and Vast Data. More than a few of those have been tabbed as potential IPO candidates in 2026, which should bring more dividend firepower. We should also consider that, as OpenAI aims to raise more capital with a valuation between $750 billion-$830 billion, SuRo’s September-quarter exposure still reflected OpenAI’s then $300 billion valuation. It’s fair to deduce that the initial investment of $17.7 million is worth more than the fair value estimate of $27.7 million, time-stamped at the end of September. We say that full well knowing OpenAI’s last capital raise, which was completed early in the current quarter, left it with a valuation of $500 billion. With SuRo shares trading below their net asset value of $9.23 per share exiting September, it could very well see management put to work some of the $25 million remaining under its share repurchase program that ends in October 2026. We are inclined to remain longer-term investors in SSSS to capture additional upside as SuRo continues to monetize its portfolio, moves that should also enable further dividend payments. The IPO market looks to remain vibrant in 2026, but we will continue to monitor it closely, and should we see indications emerge that it is drying up, we may reconsider the place for SSSS shares in the Pro Portfolio. Fortunately, such a slowdown does not appear to be on the horizon.
December Price Change: 2.1%; Yield: 5.30%
INVESTMENT THESIS: SuRo Capital is a business development company (BDC) that invests in high-growth, venture-backed private companies. As SuRo monetizes those portfolio investments through either IPO or M&A transactions, it must pay out most of its earnings to shareholders in the form of dividends. What’s important to factor into our thinking is that SuRo’s strategy isn’t to hold public company investments but rather to monetize them following the lock-up expiration. Sometimes this can be immediate, and sometimes it can be in stages, but when that monetization occurs, it triggers dividend payments. And because a BDC must pay out at least 90% of its taxable income through dividends to shareholders, there is the possibility of a special dividend to hit that qualifying threshold late in the year. As we think about this, it means that we should focus on total return with SSSS, which is defined as capital gains in the shares plus dividends received while owning them. What this means is even if we see SSSS shares trade sideways or move lower, depending on the size of the dividend payments in the coming quarters, the position’s total return could still be sizable for the Pro Portfolio. SuRo's portfolio holdings at the end of June included CoreWeave, ServiceTitan, OpenAI, Liquid Death, Whoop, and fintech company Plaid, as well as roughly 30 other holdings.
Target Price: $12; Rating: One
Panic Point: $8.00
RISKS: Industry and economic risk, competition and competitive pressures, and acquisition risk.
Waste Management WM; $219.71; 1,000 shares; 4.00%; Sector: Industrials
UPDATE: After posting a strong rebound in November, shares of Waste Management (WM) added to those gains in December, even before we include the company’s latest $0.825 per share quarterly dividend payment received on December 19. Those gains tipped Waste’s 2025 gain to more than 9%. We continue to favor the company’s inelastic business model that allows it to drive pricing, while management simultaneously aims to take incremental cost out of the business and grow by acquisition, both for the core waste one as well as the newer medical waste business. While WM has yet to fully realize synergy targets with the newer medical waste business, we continue to see the medical testing market growing at a steady pace, hence our position in Labcorp. As we’ve shared before, that is a combination that will keep us patient with WM shares. Helping us maintain that patience, management sees the company’s 2026 free cash flow near $3.8 billion, up around 30% year over year. That led the company to share in mid-December to announce a 14.5% dividend increase to $0.945 per share per quarter starting in 2026 and a new $3 billion share repurchase plan. What’s important is that the buyback program is upsized from the prior $1.5 billion one, but WM is re-enacting the program after putting it on hold to right-size its balance sheet following its November 2024 acquisition of Stericycle. But there was a third component to that announcement – management reiterating its tuck-in acquisition strategy. That trifecta of announcements tells us the Waste Management story is very much on track, giving us room to reiterate our $255 price target.
December Price Change: 0.8%; Yield: 1.72%
INVESTMENT THESIS: Waste Management’s core business is the inelastic waste removal business for residential, enterprise, and other customers. The company has built its footprint through a series of acquisitions and excelled at wringing costs out of them, driving free cash flow, dividends, and funding incremental acquisition activity. While the residential business is sticky, the commercial business should continue to benefit from non-residential construction activity. Margins should continue to inch higher due to disciplined pricing and increasing use of automation. We are in the early days of WM Healthcare Solutions, but we see the business growing as management integrates and cross-sells against its core business and flexes the ability to integrate nip-and-tuck acquisitions as it has at the core waste business. Here, too, we see room to consolidate a fragmented industry, which makes this a natural fit for Waste Management.
Target Price: $255; Rating: One
Panic Point: $190
RISKS: Industry and economic risk, competition and competitive pressures, and acquisition risk.
TWOS
Alphabet GOOGL; $313.00; 677 shares; 3.86%; Sector: Communication Services
UPDATE: Following back-to-back double-digit gains in October and November, shares of Alphabet (GOOGL) took a breather in December. That modest move lower barely put a dent in the cumulative Q4 2025 move near 29%. Paired with gains from earlier in the year, the 65% gain in GOOGL shares made them one of the Portfolio’s best performers in 2025. We continue to see Google very well positioned in the AI race as it flexes its Search, shopping, and YouTube efforts to benefit its Gemini 3 model. Data from Sensor Tower showed that during November, Gemini's monthly active users climbed 30% to 346 million, a move that likely reflects embedding Gemini into its core Search business. That has also been a likely factor in Google maintaining 90% global search engine market share over the trailing 12 months. We see further gains ahead for Google AI efforts, including the AI relationship with Apple for the upcoming AI-enabled Siri refresh. During December, Alphabet acquired data center and energy infrastructure solutions company Intersect for $4.75 billion, a move that should help the come bring additional data center capacity onstream faster. As Google Cloud brings more of that capacity on stream, we should see corresponding revenue grow and margins expand over time. As we move into 2026, we will continue to monitor Google’s advertising efforts, which have included more ads on YouTube and could eventually include ads in Gemini. We are also interested to see how the company expands its YouTube TV plans, a move that has the potential to expand the world’s biggest video platform further as it takes more share from broadcast and cable competitors.
December Price Change: -2.2%; Yield: 0.27%
INVESTMENT THESIS: We believe that while search and digital ad dominance are what will carry the shares in the near-to mid-term, longer-term, it is the company's artificial intelligence "moat" that will provide for new avenues of growth. Exiting the March 2025 quarter, Alphabet reported over 270 million paid subscriptions across YouTube and Google One. YouTube Music and Premium alone reached 125 million subscribers globally. AI is what has made the company's search, video, and targeted ad capabilities best-in-class and is the driving force behind the company's success in voice (Google Home) and autonomous driving (Waymo). Furthermore, we believe it is this AI expertise that will also make the company more prevalent in other industries, including healthcare via its subsidiary Verily, as AI and machine learning continue to disrupt operations across industries. Exiting the March 2025 quarter, across all its products, Alphabet had 0.5 billion users using its Gemini models. Adding to our positive view of the company's future opportunities, we believe that Alphabet's free cash flow generation and solid balance sheet set it apart and are what will allow the company to continue taking chances on far-out, ground-breaking, and potentially world-changing projects, as well as fund capital returns to shareholders. We will continue to monitor advertising spend as well as the competitive landscape for the company’s core Search and Advertising business. Should we see GOOGL shares pull back near the 50-day moving average, near $295, that incremental upside to our price target would give us sufficient reason to revisit our Two rating.
Target Price: Reiterate $350; Rating: Two
Panic Point: $225
RISKS: Regulatory risk (data privacy), competition, and macroeconomic slowdown impacting consumers and therefore ad buyer activity.
American Express AXP; $369.95; 640 shares; 4.31%; Sector: Financial Services
UPDATE: Shares of American Express (AXP) were a stalwart during Q4 2025, with gains put in each month of the quarter. The combined increase for the three-month period was more than 11%, well above the more modest gain for the S&P 500. AXP shares also outperformed for the full year 2025 with a gain near 25%. Back in mid-November, we lifted our price target for AXP shares to $385 from $370 following management comments about the Platinum Card refresh “going very well.” On Dec. 11, we lifted that price target again to $400 following comments from Amex CEO Stephen Squeri. Squeri shared that the company’s network saw a 9% growth in U.S. retail consumer spending around the key Thanksgiving holiday week, with Platinum retail U.S. consumer spending up 13%. Squeri also said that Platinum is surpassing company expectations in new card acquisitions for both new small businesses and consumers. We see that as a positive for expanding its membership and driving its average fee per card. Remember, Amex’s net card fee revenue accounts for nearly 70% of its pre-tax income, and Squeri’s comments suggest we could see Amex guide 2026 EPS above the $17.49 consensus forecast. In mid-December, Amex said that it will pay its next $0.82 per share quarterly dividend on February 10 to shareholders of record as of January 2. We’d note this marks Amex’s fourth consecutive quarterly dividend at that level, which means come early March, we could see a fresh dividend increase.
December Price Change: 1.3%; Yield: 0.89%
INVESTMENT THESIS: American Express is a globally integrated, membership-driven payments company, providing customers with access to products, insights, and experiences that enrich lives and build business success. The company has four reportable operating segments: U.S. Consumer Services (USCS), Commercial Services (CS), International Card Services (ICS), and Global Merchant and Network Services (GMNS). American Express targets the premium consumer space by continuing to deliver membership benefits that span our customers’ everyday spending, borrowing, travel, and lifestyle needs, expanding its roster of business partners around the globe, and developing a range of experiences that attract high-spending customers. In 2024, the company’s net card fee revenue accounted for 65% of its pre-tax income, which we see providing a differentiated business model that should continue to grow as Amex wins new card members and drives its average fee per card higher.
Target Price: Reiterate $400; Rating: Two
Panic Point: $295
RISKS: Slowdown in consumer spending, competition, membership growth, merchant acceptance, and lack of new product innovation.
Apple AAPL; $271.86; 825 shares; 4.09%; Sector: Technology
UPDATE: Following the string of month-over-month gains between June and November of this year, Apple (AAPL) shares declined modestly in December. Even so, the shares were a strong performer in Q4 2025 and in 2025 for the Portfolio. While indications of December-quarter iPhone sales were robust, research firm CounterPoint Research sees the global smartphone market declining around 2% on a shipment basis in 2026, primarily because of rising memory costs. Counterpoint’s thinking is that higher memory costs, especially for DRAM, are driving up the bill of materials for a smartphone, and companies are passing that through to consumers. Data from Trendforce indicate demand for RAM chips exceeds supply by 10% and is growing, and it sees another jump in DRAM prices in the coming quarter. Because companies like Micron have shifted production to meet as much of the AI-related demand for high-end memory as they can, it means fewer chips and higher costs for other segments of the market, including smartphones. That could lead to higher smartphone prices, which could be a headwind for replacement demand. However, in the coming quarters, Apple is expected to deliver its revamped, AI-enabled Siri, which could foster a quicker iPhone upgrade cycle. Based on data published by IDC and CounterPoint Research, Apple shipped ~2.1 billion iPhones between 2015-Q3 2024 and more than 235 million since Q4 2024. This suggests Apple has a massive upgrade opportunity should the AI-enabled Siri deliver on Apple’s promise and delight users. While we wait for Apple to unveil this revamped Siri, the shares could be range-bound, but we’ll want to remain shareholders should that revamp of Siri come sooner than expected. On Dec. 23, we published a more detailed look at Apple’s expected 2026 new product launches, adding that, as excited as we are for some of these new models, we would like to see what Apple has up its sleeve for the higher-margin, less seasonal Services business. Upcoming catalysts include December revenue reports from Taiwan Semi and Foxconn, as well as any Winter-Spring 2026 Apple event. Based on those data points, we’ll revisit our AAPL price target and rating as needed.
December Price Change: -2.5%; Yield: 0.38%
INVESTMENT THESIS: While we acknowledge that near-to-midterm performance remains heavily influenced by iPhone sales, the dynamic is shifting as investors finally place greater emphasis on Services growth. We are bullish on the 5G upgrade cycle and believe longer-term upside will continue to come as Services revenue grows its share of overall sales. Services provide for a recurring revenue stream at higher margins, a factor that serves to reduce earnings volatility while allowing for a higher percentage of sales to fall to the bottom line; as a result, we believe that Services growth and the installed base are much more important than how many devices the company can sell in each 90-day period. In addition to improved profitability, we also believe the transparent nature of this revenue stream will demand an expanded price-to-earnings multiple as segment sales grow. Furthermore, we believe that Apple's desire to push deeper into the healthcare arena will help make its devices invaluable as more life-changing features are added and the company works to democratize health records.
Target Price: Reiterate $305; Rating: Two
Panic Point: $222
RISKS: Slowdown in consumer spending, competition, lack of new product innovation, elongated replacement cycles, and failure to execute on Services growth initiatives.
Bank of America Corp. BAC; $55.00; 4,410 shares; 4.42%; Sector: Financial Services
UPDATE: Shares of Bank of America (BAC) continued to be a strong performer for the Portfolio, rising another 3% in December. Combined with gains earlier in the current quarter, BAC shares finished the final quarter of 2025 up close to 7% and more than 25% for the year, making it one of our strongest performers. 2025 was a near record in terms of the number of M&A deals. In particular, 70 deals were worth more than $10 billion each, with more than 20 of those outsized deals occurring in Q4 2025. Looking forward to 2026, lower interest rates and relaxed antitrust oversight argue for more M&A to happen. Following further IPO transactions being priced by mid-December that set the stage for vibrant investment banking activity to continue in 2026, we increased our BAC price target to $65 from $60. We chalk that vibrant outlook to the incrementally lower interest-rate environment that should lower deal hurdle rates, but also the government shutdown that delayed IPO filings and subsequent transactions in Q4 2025. This suggests IPO activity in Q1 2026 could be stronger than previously expected. As we move through H1 2026, we’ll have a better sense of timing for some of the large IPOs from Anthropic, OpenAI, Databricks, Stripe, and others. We’ll also continue to monitor M&A, the other big driver of investment banking activity. Based on what we see develop, we’ll revisit our BAC price target as needed. The same goes for loan activity following the Fed’s multiple rate cuts in 2024 and 2025, and potentially more to come in 2026. We’ll also keep a close watch on BofA’s expense line following comments from chairman and CEO Brian Moynihan that the company continues to take costs out of the business. From a portfolio management standpoint, BAC shares have flirted with becoming a 4.5% position size, and if they pass that threshold in the coming days, we will bow to our discipline and lock in a slice of hefty gains for the Portfolio and members.
December Price Change: 2.5%; Yield: 2.04%
INVESTMENT THESIS: Bank of America is one of the world's leading financial institutions, serving individual consumers, small- and middle-market businesses, and large corporations with a full range of banking, investing, asset management, and other financial and risk management products and services. The company provides unmatched convenience in the United States, serving approximately 69 million consumers and small business clients with approximately 3,700 retail financial centers, approximately 15,000 ATMs, and award-winning digital banking with approximately 59 million verified digital users. Bank of America is a global leader in wealth management, corporate and investment banking, and trading across a broad range of asset classes, serving corporations, governments, institutions, and individuals around the world. Bank of America offers industry-leading support to approximately 3 million small business households through a suite of innovative, easy-to-use online products and services. The company serves clients through operations across the United States, its territories, and approximately 35 countries. From a reporting perspective, the company's business breaks down as follows: Net Interest Income breakdown: Consumer Banking 57%, Global Banking 23%, Global Wealth & Investment Management 14%, and Global Markets 6%; Income Before Tax breakdown: Consumer Banking 42%, Global Banking 27%, Global Wealth & Investment Management 16%, and Global Markets 15%. Bank of America pays a quarterly dividend of $0.28 per share, up from $0.18 a few years ago.
Target Price: $65; Rating: Two
Panic Point: $44
RISKS: Financial markets, fiscal, monetary, and regulatory policies, economic conditions, and credit ratings.
Broadcom Inc. AVGO; $346.10; 200 shares; 1.26%; Sector: Technology
UPDATE: On December 12, we explained that we were contemplating a move that would re-jigger the Portfolio’s chip holdings, which would allow us to initiate a position in Broadcom (AVGO) . On Dec. 17, we made that move after AVGO shares positively tested technical support, starting them with a Two rating and a $445 price target. Consensus forecasts have Broadcom delivering EPS growth of ~43% in 2026 and 2027, which is backed by the company’s $73 billion in backlog that Broadcom management expects to ship over the next six quarters, as well as the expectation for continued AI order growth. Part of that stems from its position in the custom AI chip space, which complements our exposure with Marvell. But that $73 billion is less than half of Broadcom’s overall backlog of $162 billion, which is up from $110 billion exiting the company’s August quarter. Should we see AVGO shares linger and build a base near current levels, that would allow us to build up a position over time. If AVGO shares pulled back and closed the gap in the chart near $305, we would use that to increase the Portfolio’s position at a quicker pace. Upcoming catalysts include CES 2026 and December-quarter earnings season comments about AI and data-center capital spending, as well as AI adoption and usage.
December Price Change: 1.5%; Yield: 0.75%
INVESTMENT THESIS: We became shareholders in Broadcom (AVGO) to participate as the company benefits from the buildout of digital infrastructure, including AI, data center, and custom AI chips, as well as demand for its software and services segment, which includes private cloud, mainframe software, cybersecurity, and enterprise software. Broadcom reports its business in two segments – Semiconductor Solutions (58% of sales and 51% of operating income) and Infrastructure Software (42%, 49%). The Broadcom management team has developed a track record of delivering organic growth and growth by acquisition, with the latter positioning the company to better position itself to meet developing demands. More recent acquisitions include Brocade Communications, CA, Inc., Symantec Enterprise Security, and VMware.
Target Price: $445; Rating: Two
Panic Point: $275
RISKS: Economic, governmental regulations, geopolitical developments, cyclical, and investment risk.
Dutch Bros BROS; $61.22; 3,678 shares; 4.10%; Sector: Consumer Cyclical
UPDATE: December was a strong month for Dutch Bros (BROS) , and capped a strong quarter, with the shares delivering a hefty double-digit gain in Q4 2025. During the quarter, consumers continued to open their wallets, especially at drive-through coffee locations with baristas, and Dutch Bros continued to expand its footprint. While the company did not formally announce new locations, we’ve identified new ones in North Carolina, Kentucky, and other states during December. Recall that in November, Dutch Bros delivered quarterly results that topped market expectations with systemwide same-store sales that rose 5.7% year over year. Dutch’s footprint expansion was a headwind for margins in the quarter as it opened 38 shops, bringing its total to 1,081. As part of that expansion, Dutch also entered five new states during the quarter, which also contributed to that headwind. That was a brisker pace of store openings compared to 31 in the June quarter and 30 in the March quarter. Based on the company’s shop count target for this year, we expected greater shop openings in H2 2025, and that is what we’re getting. With the opening pace stepping up in 2026 and management reiterating its 2029 shop count by 2029, this leads us to think the margin pressure will be more than a one-quarter speed bump. We expect more clarification on that in the coming weeks when Dutch delivers its December-quarter results. Because the expansion story remains more than intact ever, we will want to remain owners of our own BROS shares to capture the opportunity as the growing footprint matures, margins rebound, and EPS growth accelerates. Should we see a more interest rate-friendly environment emerge in 2026, that could be one reason for us to revisit our margin assumption and price target. A drop in coffee prices would be a nice help, but let’s remember that coffee is only around 10% of Dutch Bros' cost of goods sold, a figure confirmed during our podcast conversation with Black Rock Coffee CEO Mark Davis.
December Price Change: 4.5%; Yield: 0.00%
INVESTMENT THESIS: Dutch Bros is an operator and franchisor of drive-thru shops that focus on serving high-quality, hand-crafted beverages with unparalleled speed and superior service. Coffee-based beverages make up about 50% of the menu mix, and about 25% of the menu mix is based on the company’s proprietary Blue Rebel energy drink, which is highly customizable with flavors and modifiers and can be served blended or over ice. The energy platform helps unlock the afternoon day part and broadens the company’s appeal. The remaining 25% of the menu mix is a wide variety of teas, lemonades, sodas, and smoothies. The company’s west-to-east expansion is a time-tested strategy that should drive revenue and EPS growth over the next several years. Leveraging that footprint expansion and low-single-digit comp sales growth, management reiterated its long-term guidance of around 20% annual revenue growth. Helping support that guidance, the company confirmed it will introduce an expanded food menu in 2026. Dutch Bros is slated to enter the consumer-packaged goods (CPG) space in a deal with Trilliant Food & Nutrition.
Target Price: Reiterate $75; Rating: Two
Panic Point: $42
RISKS: Commodity risks, labor costs, interest rate risk, and inflation.
First Trust Nasdaq Cybersecurity ETF CIBR; $71.45; 2,545 shares; 3.31%; Sector: Cybersecurity
UPDATE: Shares of the First Trust Nasdaq Cybersecurity (CIBR) ETF were a modest drag on the Portfolio in December and Q4 2025, but they delivered double-digit gains for the Portfolio in 2025. Entering this year, research firm Gartner expected cybersecurity spending would rise $212 billion, but during August the firm increased that to $213 billion. It also forecasts cybersecurity spending accelerating in 2026 as it sees a concerted enterprise effort to shore up cloud security capabilities, particularly in relation to AI workloads. By 2028, Gartner sees that spending approaching $300 billion, and it’s that multiyear outlook that keeps us owners of CIBR shares. Backing our view as well as those figures, we saw several M&A moves by companies like Alphabet and ServiceNow as companies looked to boost their exposure to that growth market. In January, we should see Gartner and other research firms update their cybersecurity spending forecasts for the coming year, a potential positive for our CIBR shares. We would argue, however, that headlines like the very recent one about Goldman Sachs warning investors in some of its alternative investment funds that their data may have been exposed in a breach at one of the bank’s law firms are likely to be more powerful catalysts for the shares. As we move into the December-quarter earnings season, we’ll be reviewing company comments about cybersecurity spending and updating our CIBR price target as needed.
December Price Change: -3.0%; Yield: 0.42%
INVESTMENT THESIS: The First Trust Nasdaq Cybersecurity ETF seeks investment results that correspond generally to the price and yield (before the fund's fees and expenses) of an equity index called the Nasdaq CTA Cybersecurity Index. The Nasdaq CTA Cybersecurity Index is designed to track the performance of companies engaged in the cybersecurity segment of the technology and industrial sectors. It includes companies primarily involved in the building, implementation, and management of security protocols applied to private and public networks, computers, and mobile devices to protect the integrity of data and network operations. To be included in the index, a security must be listed on an index-eligible global stock exchange and classified as a cybersecurity company as determined by the Consumer Technology Association. Each security must have a worldwide market capitalization of $250 million, have a minimum three-month average daily dollar trading volume of $1 million, and have a minimum free float of 20%.
Target Price: Reiterate $85; Rating: Two
Panic Point: $63
RISKS: Cybersecurity spending, technology and product development, the timing of the product sales cycle, new products, and services in response to rapid technological changes and market developments, as well as evolving security threats.
Labcorp Holdings Inc. LH; $250.88; 790 shares; 3.61%; Sector: Healthcare
UPDATE: December was a bit of a struggle for shares of Labcorp (LH) , and mixed with their October and November performance, they were a drag on the Portfolio in Q4 2025. Still with a double-digit gain for 2025, the shares were a net positive. While it may not be a sexy business or one that generates much in the way of headlines, the company remains a well-positioned play for our Aging of the Population investing theme. We also like the continued execution of the company’s two-pronged growth strategy, which is a mix of organic growth and growth by acquisition. We see further gains ahead as Labcorp continues to expand its test and diagnostics offerings and do the same with its hospital lab footprint. As the company explained during its September-quarter earnings call, some of the expected acquisitions for Q3 2025 are closing later than expected, and a few have slipped into 2026. That suggests the company should deliver a quicker pace of EPS growth in 2026 than implied by the consensus EPS of $17.52 compared to $16.33 in 2025. Another driver of EPS upside is Labcorp’s cost-reduction initiatives and how it is adopting AI, the combination of which should help drive margins higher over time. While the Portfolio has a relatively full LH position, we will continue to look for potential entry points for members.
December Price Change: -6.7%; Yield: 1.15%
INVESTMENT THESIS: Labcorp is a global leader in innovative and comprehensive laboratory services that provide vital information to help doctors, hospitals, pharmaceutical companies, researchers, and patients make clear and confident decisions. By leveraging its diagnostics and drug development capabilities, the company provides insights and accelerates innovations to improve health and improve lives. The company is organized under two segments, consisting of Diagnostics Laboratories (Dx), which includes routine testing and specialty/esoteric testing, and Biopharma Laboratory Services (BLS), consisting of Early Development Research Laboratories and Central Laboratory Services. Our attraction to LH shares stems from the combination of the aging population driving diagnostic testing growth and the increasing array of diagnostic testing as well. That combination is expected to drive the healthcare testing services market to $12.6 billion by 2029, from $7.4 billion in 2024, according to Markets and Markets. To augment its position in oncology, women's health, autoimmune diseases, and neurology, the company has been expanding through acquisitions and partnerships with health systems and regional and local labs.
Target Price: Reiterate $300; Rating: Two
Panic Point: $228
RISKS: Macroeconomic factors, changes in healthcare reimbursement models and products, government regulations, product discontinuations, or recalls.
Microsoft Corp. MSFT; $483.62; 395 shares; 3.48%; Sector: Technology
UPDATE: Like several other Tech and AI-related positions, shares of Microsoft (MSFT) were little changed in December. While that left MSFT shares as a drag on the overall Portfolio during Q4 2025, MSFT shares rose mid-teens in 2025, making them an additive force for the Portfolio’s overall performance. In our November Roundup, we shared that MSFT shares are likely to be range-bound as the company continues to add additional AI and cloud capacity, a move that will curb margin improvement in the near-term. We continue to think that as the company digests that coming capacity, we should see a combination of faster revenue growth and margin rebound unfold in the coming quarters. Exiting September, Microsoft’s commercial remaining performance obligations (RPOs) hit $400 billion, up 50% year over year, and we should keep in mind that this does not include the recent $250 billion incremental win with OpenAI. As part of a mid-November announced partnership with Anthropic, Anthropic also said it has committed to spend $30 billion on Microsoft's Azure compute capacity and to contract additional compute capacity up to one gigawatt. In exchange, Microsoft will invest $5 billion in Anthropic. As enterprise and government AI adoption rises, Microsoft and its Azure business are positioned to benefit, which is one reason why we continue to be MSFT shareholders. Another is Microsoft’s ownership stake in OpenAI Group PBC, the for-profit OpenAI entity, and news that OpenAI is preparing for an eventual IPO, possibly in 2026. While that may not benefit Microsoft from an operating perspective, the eventual IPO will be a positive for the company’s balance sheet. We will continue to look for an inflection point in MSFT shares, one that would lead us to revisit our Two rating.
December Price Change: -1.7%; Yield: 0.75%
INVESTMENT THESIS: We believe the cloud to be a secular growth trend and that the upside to the shares will result from Microsoft's hybrid cloud leadership as the company grabs market share in this expanding industry. While companies may look to build out multi-cloud environments, Microsoft's Azure offering will be a prime choice thanks to its decision to provide the same "stack" used in the public cloud to companies for their on-premises data centers. Additionally, we would note that hybrid environments are currently the preference for most companies because they allow them to maintain critical data in-house while taking advantage of the agility and scalability provided by public clouds. Outside of the cloud opportunity, we maintain a positive view on the company's growing gaming business, which we believe is becoming an increasingly prominent factor in the Microsoft growth story as gaming becomes more mainstream, management works to convert its gaming revenue from a one-time license purchase to a recurring subscription model, and as technologies like augmented/virtual reality evolve. Finally, as it relates to LinkedIn and other subscription-based services such as O365 and various Dynamics products, we continue to value them highly for their recurring revenue streams, which, we remind members, provide for greater transparency of future earnings.
Target Price: $600; Rating: Two
Panic Point: $450
RISKS: Slowdown in IT spending, competition, and cannibalization of on-premises business by the cloud.
Morgan Stanley MS; $177.53; 1,238 shares; 4.00%; Sector: Financial Services
UPDATE: Shares of Morgan Stanley (MS) continued to be a strong performer for the Portfolio, rising roughly another 5% in December. Combined with gains earlier in the current quarter, MS shares finished the final quarter of 2025 up more than 12% and 2025 more than 40%, making it one of our strongest performers. That strength led us to do some prudent, but very profitable portfolio management when MS shares became an outsized position size in early December. 2025 was a near-record year in terms of the number of M&A deals. In particular, 70 deals were worth more than $10 billion each, with more than 20 of those outsized deals occurring in Q4 2025. Looking forward to 2026, lower interest rates and relaxed antitrust oversight argue for more M&A to happen. Following further IPO transactions being priced by mid-December that set the stage for vibrant investment banking activity to continue in 2026, we increased our MS price target to $185 from $170. We chalk that vibrant outlook to the incrementally lower interest rate environment that should lower deal hurdle rates, but also the government shutdown that delayed IPO filings and subsequent transactions in Q4 2025. This suggests IPO activity in Q1 2026 could be stronger than previously expected. As we move through H1 2026, we’ll have a better sense of timing for some of the large IPOs from Anthropic, OpenAI, Databricks, Stripe, and others. We’ll also continue to monitor M&A activity, the other big driver of investment banking activity. Based on what we see develop, we’ll revisit our MS price target as needed.
December Price Change: 4.6%; Yield: 2.25%
INVESTMENT THESIS: Morgan Stanley reports in three business segments: Institutional Securities (42% of trailing 12-month revenue, 38% of trailing 12-month Income Before Tax), Wealth Management (48%, 55%), and Investment Management (10%, 6%). While the IPO window has yet to reopen, the potential IPO class for 2025 continues to build with recent additions including Klarna and StubHub. That would be a boon to private equity firms and others that have been nursing IPO candidates during the dark period and a positive for Morgan Stanley's investment banking business. Expected deregulation under the Trump administration is a potential catalyst for Morgan's M&A business. Meanwhile, folks continuing to be behind in retirement savings bodes well for Morgan Stanley's wealth management business in the coming quarters, while continued market volatility bodes well for its equity trading business.
Target Price: $185; Rating: Two
Panic Point: $135
RISKS: Market and interest rate risk, credit risk, country risk, and operational risk, including cybersecurity.
Qualcomm Inc. QCOM; $171.05; 933 shares; 2.91%; Sector: Technology
UPDATE: In December, shares of Qualcomm (QCOM) recovered some of the ground they lost in November, putting their Q4 2025 performance up ~3.0%. While we see further upside over the long term with QCOM as the company’s management team makes good on its revenue diversification plans, we recently dialed back our exposure to this Two-rated stock to make room for the Portfolio to begin a position in Broadcom. Near-term, Qualcomm’s revenue stream remains largely exposed to the smartphone market, which tends to have a seasonal slump in the first part of the calendar year. In terms of the smartphone market in 2026, research firm CounterPoint Research shared that it sees the smartphone market declining around 2% on a shipment basis, primarily because of rising memory costs. Counterpoint’s thinking is that higher memory costs, especially for DRAM, are driving up the bill of materials for a smartphone, and companies are passing that through to consumers. Data from Trendforce indicates demand for RAM chips exceeds supply by 10% and is growing, and sees another jump in DRAM prices in the coming quarter. Because companies like Micron have shifted production to meet as much of the AI-related demand for high-end memory as they can, that shift means fewer chips and higher costs for other segments of the market – personal computers, mobile phones, games, and consumer products like TVs. That suggests a potentially longer path for Qualcomm’s revenue diversification strategy, and one that could result in slower EPS growth ahead. Should the developing picture affirm that picture, we may opt to use QCOM shares as a source of funds for the Portfolio. With that in mind, the upcoming CES 2026 next week should give us much to think about.
December Price Change: 1.8%; Yield: 2.08%
INVESTMENT THESIS: Qualcomm focuses on foundational technologies for the wireless industry, including 3G (third generation), 4G (fourth generation), and 5G (fifth generation) wireless technologies and processor technologies, including high-performance, low-power computing and on-device artificial intelligence technologies. As a connected processor company, its technology roadmap aims to enable the connected intelligent edge (the next generation of smart devices) across industries and applications beyond handsets, including automotive and the Internet of Things (IoT). Qualcomm has three reportable segments: QCT (Qualcomm CDMA Technologies) semiconductor business, which develops and supplies integrated circuits and system software based on 3G/4G/5G and other technologies for use in mobile devices; automotive systems for connectivity, digital cockpit, and ADAS/AD; and IoT, including consumer electronic devices, industrial devices, and edge networking products. QCT accounts for 80% to 85% of revenue. The QTL (Qualcomm Technology Licensing) licensing business grants licenses or otherwise provides rights to use portions of the company's intellectual property portfolio, which includes certain patent rights essential to and/or useful in the manufacture and sale of certain wireless products. QTL accounts for about 15% of Qualcomm's revenue but contributes a greater portion of the company's operating income. Our focus on QCOM shares is revenue diversification as part of management's intended strategy to lessen its reliance on the smartphone market by tapping into the AI PC, IoT, and automotive chip markets. We see this unfolding over the next few years, which should lead Wall Street to revisit how it values the shares. It is that opportunity we aim to capture by owning the shares over the longer term.
Target Price: $205; Rating: Two
Panic Point: $135
RISKS: Customer risk, technology advancement, competition risk, third-party supplier, and manufacturing partner risk.
TJX Companies TJX; $153.61; 947 shares; 2.65%; Sector: Financial Services
UPDATE: Shares of TJX Companies (TJX) continued the upward climb they started in November to close out the year. Their high-single-digit finish for Q4 2025 make them a nice outperformer for the Portfolio. We continue to see the company’s portfolio of off-price merchandise benefiting from cash-strapped consumers embracing deals, sales, and off-price retailers. In TJX’s latest quarterly results, the company’s strong 5% comp sales figure, a step up from the 4% posted in the prior quarter, was well ahead of figures reported by others, including Walmart, Target, Lowe’s, and Chipotle. To that, we can add the nice level of margin improvement to 9.5% on the operating line, which was due to a combination of better product mix and lower freight costs. Both are expected to remain favorable tailwinds during the holiday shopping season and into 2026. We continue to see the TJX team as a well-seasoned group with a disciplined eye for merchandise. For now, we’ll keep our Two rating, but if we see TJX shares pull back near the $143 level, our $165 price target gives us enough upside to reconsider that rating. Let’s remember too, the company telegraphed it will continue to repurchase shares in the current quarter, which means any move back to that level could be short-lived. TJX repurchased $1.7 billion in stock, roughly 13.4 million shares, and now targets repurchasing ~$2.5 billion during fiscal 2026, which ends in January 2026. TJX will pay its next $0.425 per share quarterly dividend on March 5 to shareholders of record on February 12.
December Price Change: 1.1%; Yield: 1.11%
INVESTMENT THESIS: The TJX Companies is the leading off-price apparel and home fashions retailer in the United States and worldwide. It has over 5,000 stores and six branded e-commerce sites that offer a rapidly changing assortment of quality, fashionable, brand-name, and designer merchandise at prices generally 20% to 60% below full-price retailers’ regular prices on comparable merchandise. The company operates in four segments: Marmaxx and HomeGoods, both in the U.S.; TJX Canada, and TJX International. TJX looks to capitalize on opportunities to acquire merchandise at substantial discounts that regularly arise from the production and flow of inventory in the apparel and home fashions marketplace. These opportunities include, among others, closeouts from brands, manufacturers, and other retailers; special production direct from brands and factories; order cancellations; and manufacturer overruns. We see that positioning TJX extremely well, as consumers feel the pinch of ongoing inflation pressures and their efforts to stretch the disposable spending dollars they do have, including tapping discounted shopping locations.
Target Price: $165; Rating: Two
Panic Point: $115
RISKS: Operational, strategic buying, and competitive risks, as well as consumer spending patterns.
United Rentals URI; $809.32; 235 shares; 3.46%; Sector: Industrials
UPDATE: While October and November were tough months for shares of United Rentals (URI) , the December rebound led URI to finish 2025 not very far behind the S&P 500’s gain for the year. We chalk that movement during Q4 2025 largely to the lack of construction spending data, but that will be rectified in late January when we finally get construction spending data for September and October. Given the expected build-out of data center capacity and corresponding power demands, as well as other infrastructure, semiconductor, and non-residential projects, we continue to see better days ahead for the company and the stock. We also continue to see construction activity improving as we move through 2026, as the monetary policy moves from restrictive to more neutral territory, leading to further improvement in interest rates. While housing construction was a drag in much of 2025, a rebound in that market would be another positive demand driver for United’s rental fleet. As we enter 2026, we are in a seasonally slower time of year for United’s business and one that could pose weather-related disruptions, but as we approach the seasonally stronger Q2 2026, we will revisit our Two rating as needed.
December Price Change: -0.7%; Yield: 0.88%
INVESTMENT THESIS: United Rentals, the largest equipment rental company in the world, operates throughout the United States and Canada, and has a limited presence in Europe, Australia, and New Zealand. It serves industrial and other non-construction, commercial (or private non-residential) construction, and residential construction. Industrial and other non-construction rentals represented approximately 50% of rental revenue, primarily reflecting rentals to manufacturers, energy companies, chemical companies, paper mills, railroads, shipbuilders, utilities, retailers and infrastructure entities; commercial construction rentals represented approximately 46% of rental revenue, primarily reflecting rentals related to the construction and remodeling of facilities for office space, lodging, healthcare, entertainment and other commercial purposes; and residential rentals around 4% of revenue. We see the company benefiting on three fronts — the seasonal uptick in construction spending, the release of funds and projects associated with the five-year Biden administration infrastructure bill, data center construction and other re-shoring projects, and the company's nip-and-tuck acquisition strategy that should further enhance its geographic footprint.
Target Price: Reiterate $1,000; Rating: Two
Panic Point: $775
RISKS: Industry and economic risk, competition and competitive pressures, and acquisition risk.
Welltower Inc. WELL; $185.61; 592 shares; 2.00%; Sector: Real Estate
UPDATE: Following their 15% surge in November, shares of Welltower (WELL) gave some of those gains back, but finished Q4 2025 up more than 4%, making them an outperformer relative to the S&P 500. When we first started the Portfolio’s position in Welltower in September, we noted our intention to increase our exposure over time because of the strong position Welltower enjoys between the Silver Tsunami tailwind and the looming senior housing shortage. We see that driving pricing power in the form of favorable rent escalation that should translate into margins, EPS growth, and cash flow as utilization levels creep higher. Given Welltower’s REIT structure, that should also lead to further dividend increases. As the Fed moves further down the Fed Funds rate curve, we should see WELL shares benefit from lower project hurdle rates and investors revisiting its dividend stream and corresponding yield. With that in mind, we took advantage of the December pullback in the shares to scoop up more on Dec. 15 at $188.31. Following that trade, the Portfolio still has room to grow its position size, landing WELL on our shopping list.
December Price Change: -10.9%; Yield: 1.63%
INVESTMENT THESIS: Welltower, a real estate investment trust (REIT), owns interests in properties concentrated in major, high-growth markets in the United States, Canada, and the United Kingdom, consisting of seniors housing, post-acute communities, and outpatient medical properties. We see the company benefiting from the intersection of the demographic shift that is the aging population and the looming pain point that is the shortage of inventory for senior housing, which fell below 1% in Q2 2025, according to the National Investment Center for Seniors Housing & Care. Over the next five years, more than 4 million boomers will hit age 80, and that’s in addition to the roughly 4% of the U.S. population that is 80-plus years old in 2024. As this demographic shift unfolds, we should see a relatively steady growth rate in Welltower’s revenue, NOI, and FFO, which, in turn, given its REIT status, should drive its payable dividend stream higher. Because of the favorable demographic tailwind and lower interest rate path telegraphed by the Federal Reserve, which should reduce construction costs over time, as well as bring REIT stocks back into favor, we intend to be long-term holders of WELL shares. Our plan is to build the position size methodically, increasing the Portfolio’s dividend stream along the way.
Target Price: $205; Rating: Two
Panic Point: $141
RISKS: Operational risk, operator and tenant risk, competitive risks, and acquisition risk.
Not Rated
EPS Diplomats Model; 2.17%; Sector: N/M
UPDATE: On November 17, we enacted the EPS Diplomats model strategy as part of the Pro Portfolio, and through the end of 2025, it returned ~4.6%, more than a 90% larger return than the one posted by the S&P 500 over the same time frame. Each position initially accounted for 0.25% of the Pro Portfolio’s assets, leading the basket to start off at 2.0% of the overall Pro Portfolio. On Dec. 31, we adjusted the eight holdings that comprised the model’s basket, and on January 2, we reconstituted the model with new positions in Credo Technology (CRDO) , Equinox Gold (EQX), SiTime Corp. (SITM) , Pan American Silver (PAAS) , Lumentum (LITE) , Kinross Gold (KGC) , Carvana (CVNA) , and IAMGold Corp. (IAG), and reset the holdings for each model constituent back to 0.25%. The only time we may adjust the model’s composition during the quarter is if a company is acquired. Otherwise, the model is set until the next reconstitution. As such, there are no price targets or ratings for each of the positions that make up the basket. That same selection process will be repeated quarterly, which means housekeeping for the model should be minimal. It also means you can expect minimal activity to occur at quarter-end and the start of the new quarter. As members become more familiar with the EPS Diplomats strategy, we may elect to increase the overall position size of the model’s basket, but that would only coincide with a reconstitution cycle. With that in mind, the next set of active dates for the model will be 3/31/26 and 4/01/26.
December Price Change: 4.6%; Yield: 0.70%
INVESTMENT THESIS: EPS Diplomats is a model of large-cap companies that offer the fastest rate of EPS growth over a multi-year period. That basket is screened regardless of industry sector or sub-sector, which means the down-selected list of companies can span a wide array of sectors. The focus is on earnings growth because earnings growth is often seen as a signal of a company's competitive strength, operational efficiencies, and future growth potential. Shares of companies that provide historically consistent earnings growth faster than the stock market receive premium valuations compared to those awarded to the S&P 500. And as we’ve often discussed with you, multiple expansion paired with earnings growth tends to drive outperformance relative to the market, better known as alpha. The basket of eight stocks is reconstituted on a quarterly basis to reflect updated EPS expectations for the current year and the following one.
Target Price: N/M
Panic Point: N/M
RISKS: Macro and end market risk, individual company risk, and consensus EPS expectations.
