Charting the S&P: This Indicator Is Starting to Roll Over
A bullish season is upon us and markets are supposed to be rallying, but sometimes trends don't cooperate.
You've reached your free article limit
You've read 0 of 1 free Pro articles.
If there is one thing we know about markets, it's that they are very unpredictable. A buyer and a seller makes a market, but patterns and trends can tip the direction. For instance, the current time period has usually favored the bulls, where bullish seasonal patterns exert their power as stocks normally rise leading up to the holidays and the new year. Good tidings, we presume.
But of course, these patterns are not always consistent and timely, which can be frustrating if we rely on those patterns to make investing decisions. Further, our angst with the markets when they retreat -- like these past two weeks -- test our patience and fortitude, for we won't give up so easily if the calendar tells us not to do it.
The chart barely remains bullish, but barely.
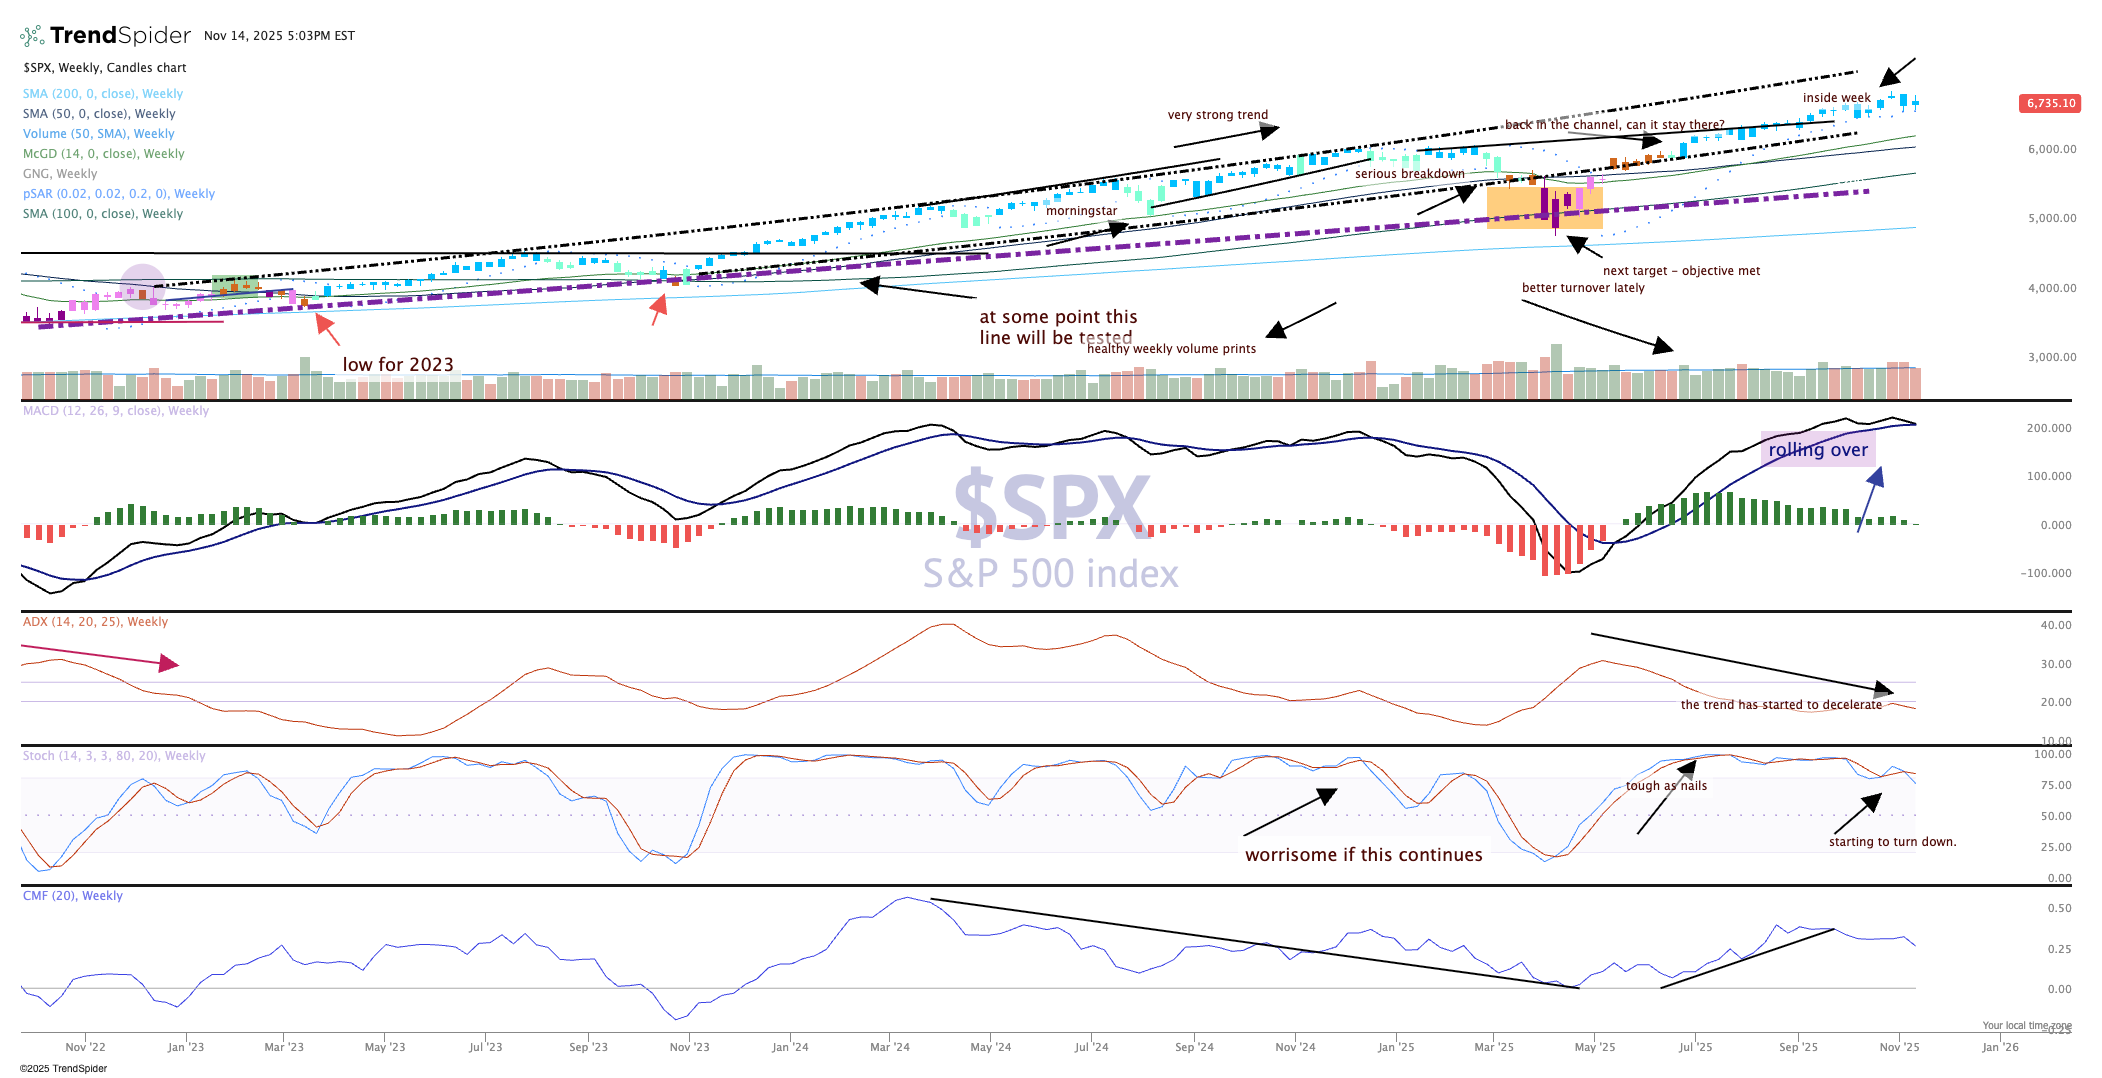
This is another important week for the markets to retain their composure. We just completed an inside week, lower-high but higher-low. This simply means the S&P 500 is trying to establish a range.
As we can see in the second pane on the chart, the Moving Average Convergence Divergence is starting roll over here for the first time since a serious breakdown occurred in January and then in April. Not on the bulls' bingo card, for sure.
