Charting the S&P 500: Will Streak of Down Weeks Come to an End?
There was more ugliness last week as the 40-week moving average failed to hold.
You've reached your free article limit
You've read 0 of 1 free Pro articles.
 Markets Open Ahead Of Fed's Latest Interest Rate Move
Stocks soared Monday morning on President Trump's announcement of "productive" talks with Iran and postponement of strikes against Iranian power plants for a period of five days.
It seems like eons since the markets have risen during a trading week. The past week marks three straight down weeks for the indexes and once again on higher volume.
Notice the arrow in the top chart pointing towards volume? Elevated turnover when the market is going down simply means distribution. What is that you ask? This is professional selling by large institutions, preferring to raise cash and wait for the next shoe to drop rather than hold through a hail storm.
Now, one might wonder if this is actually a good time to be selling. After all, when the crowd gets their arm twisted enough they tend to sell at precisely the wrong moment. Yet, the big money is not often wrong, and if you're following that crowd you're likely to save yourself from big losses.
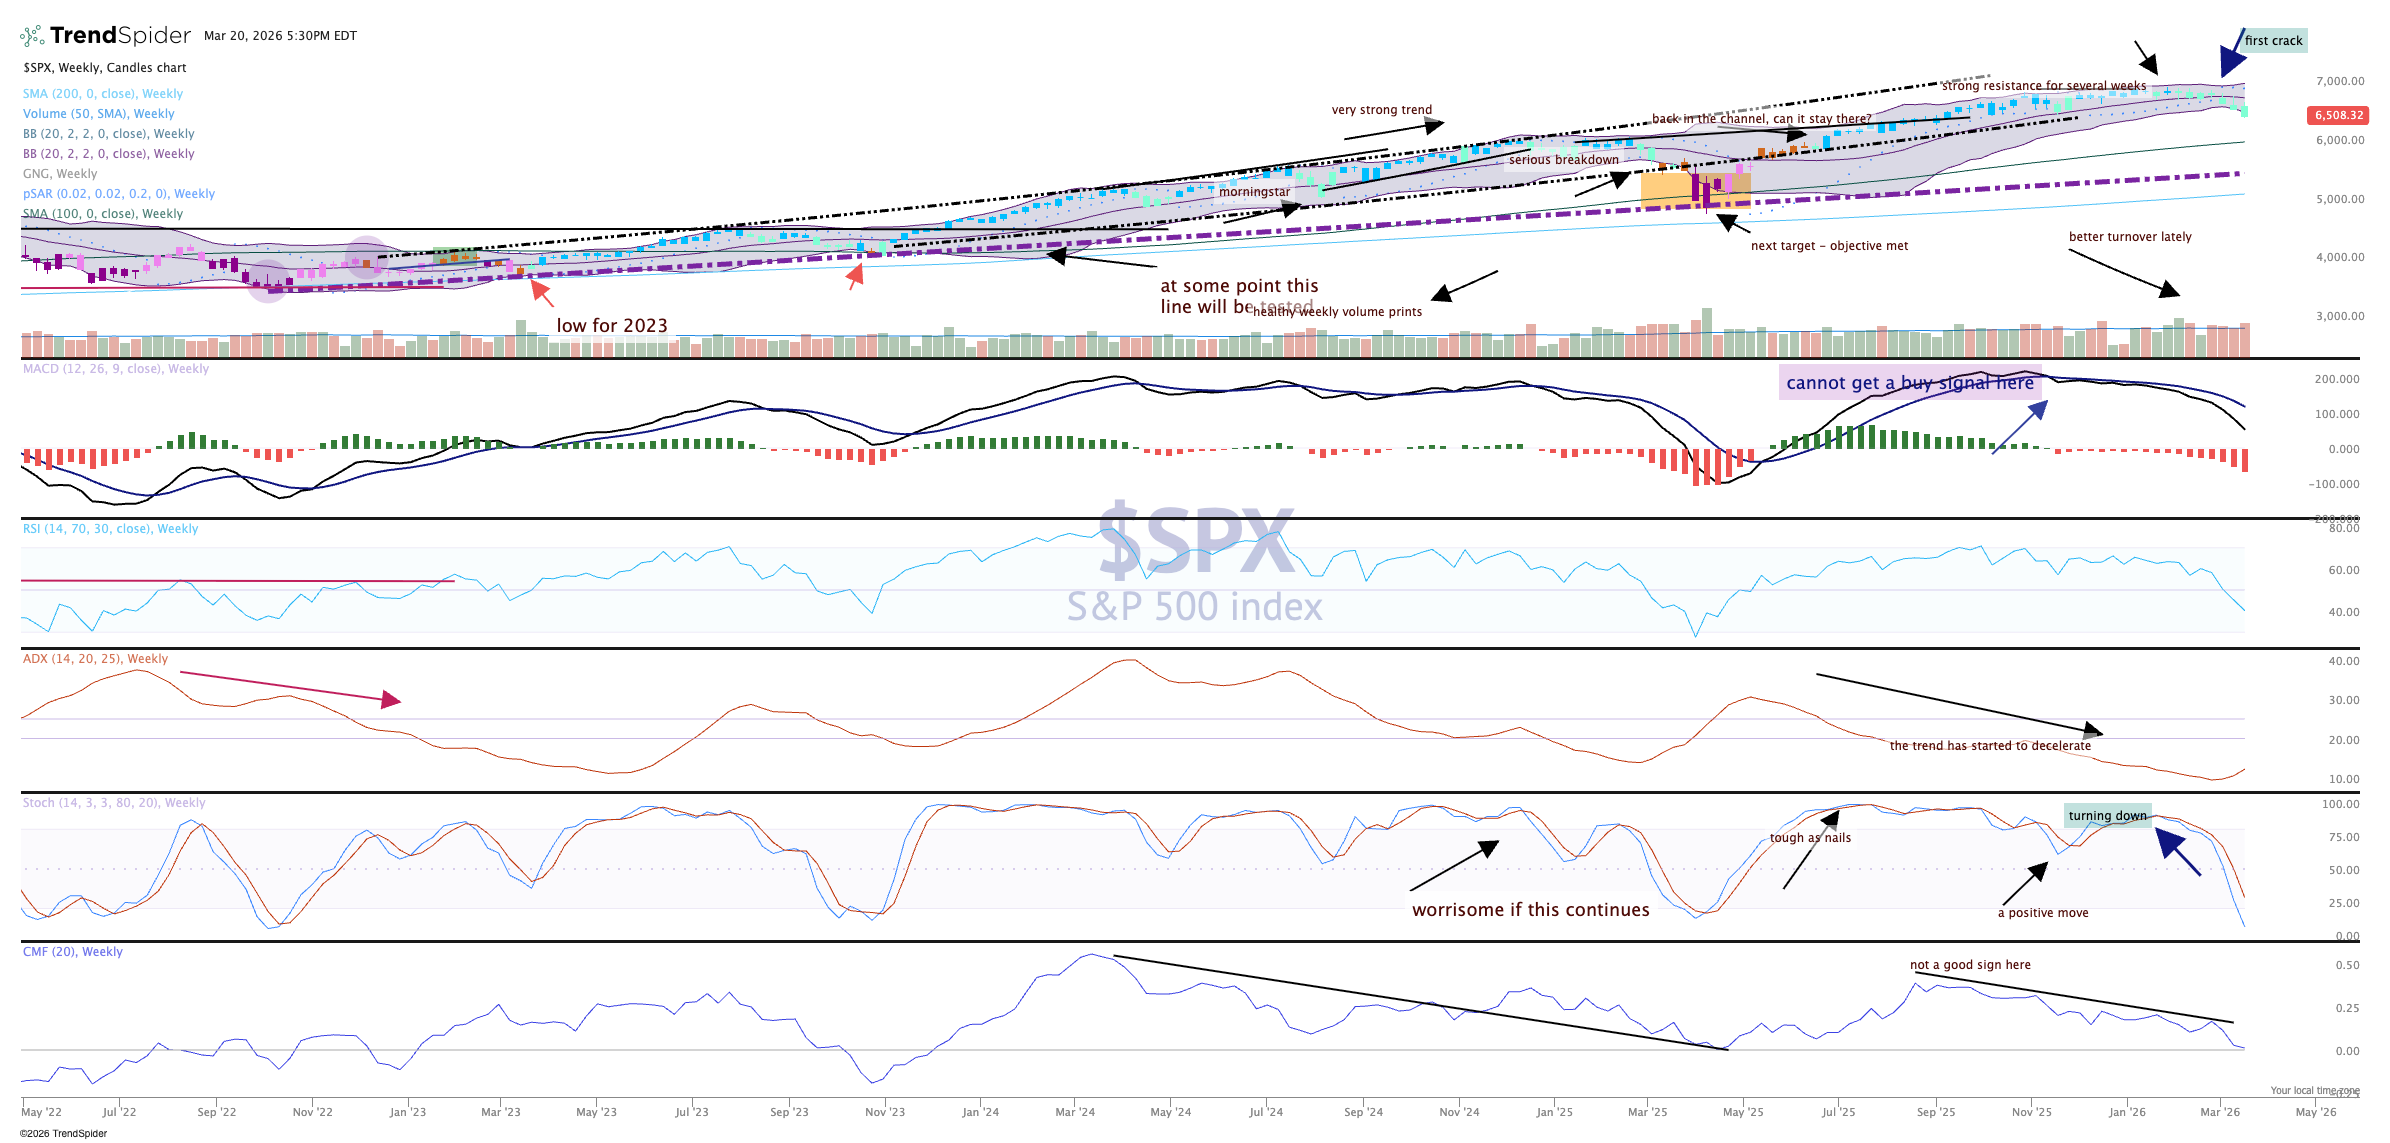
The chart remains bearish as do the indicators. Notice the Chaikin money flow at the bottom has turned down, which indicates some heavy selling this past week. Stochastics are way down and the ADX is turning higher, which means the trend is becoming more powerful. The current trend is down.
At some point there will be a strong rally, but failing good support levels as we did this past week will make it harder to rise up. Resistance is everywhere.
