Charting the S&P 500: Why Recent Action May Not Inspire the Bulls or Bears
Stocks are going sideways but are staying away from heavy distribution.
You've reached your free article limit
You've read 0 of 1 free Pro articles.
We pulled up the chart this week to show a bit less time, but more pronounced moves by the S&P 500. Our point is to show the recent flattening out of the index right at the highs of 6500.
It is quite clear this is going to be a tough hurdle to pass, given the fact the last four weeks the index was rejected soundly. That would normally set up a bearish scenario (if you're not going up, you're going down), but in this case the mild volume prints are not seen as distribution.
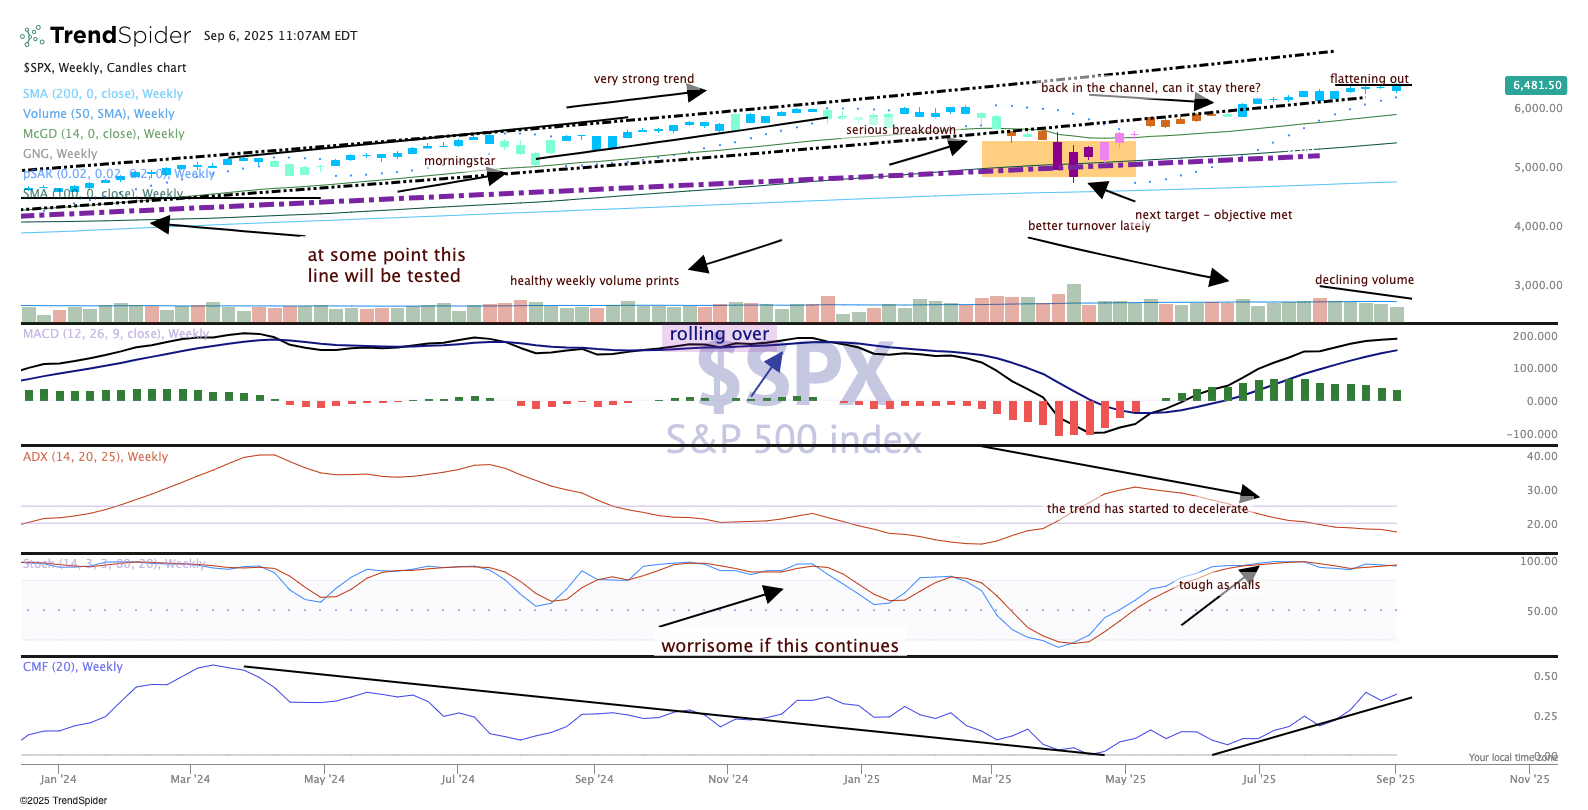
Remember, distribution is simply more volume selling than the prior day and if there are clusters of distribution that often means the stock market is in trouble. As we see in the top part of the chart, the volume over the last six weeks has been declining, but the index has been gasping for air to move higher.
The fact the S&P has not fallen more is due to the rotation we are seeing in the market. That can be a healthy situation as money stays with equities but just moves around a bit.
Notice the continued improvement in Chaikin money flow (bottom pane), while MACD (moving average convergence/divergence) remains strong and has since May. With some important data and the Fed meeting coming up soon we don't expect to see this flat base exist for too much longer.
