Charting the S&P 500: What's Next After Phenomenal Feat?
The index marked a phenomenal feat in a tough environment and a closer look at the charts is warranted.
You've reached your free article limit
You've read 0 of 1 free Pro articles.
The bulls were strutting their stuff this past week as the S&P 500 landed higher each trading day.
That is a phenomenal feat in an environment where the market was overbought each day and got even more so by the end of the week, even as Moody's downgraded the country's credit rating.
Remember, an overbought market is a condition and not a signal, hence we need to be on watch for a pullback but are not in the prediction game. We simply need to understand and respect the condition and proceed accordingly.
A pullback of significance (4%?) might offer up a great buying opportunity, so if that occurs we'll be ready for it, as should you. As for the chart, MACD is turning for a buy signal and will confirm this in a couple of weeks.
We mentioned the battleground for the index recently, that has virtually been removed from consideration with these last two price bars.
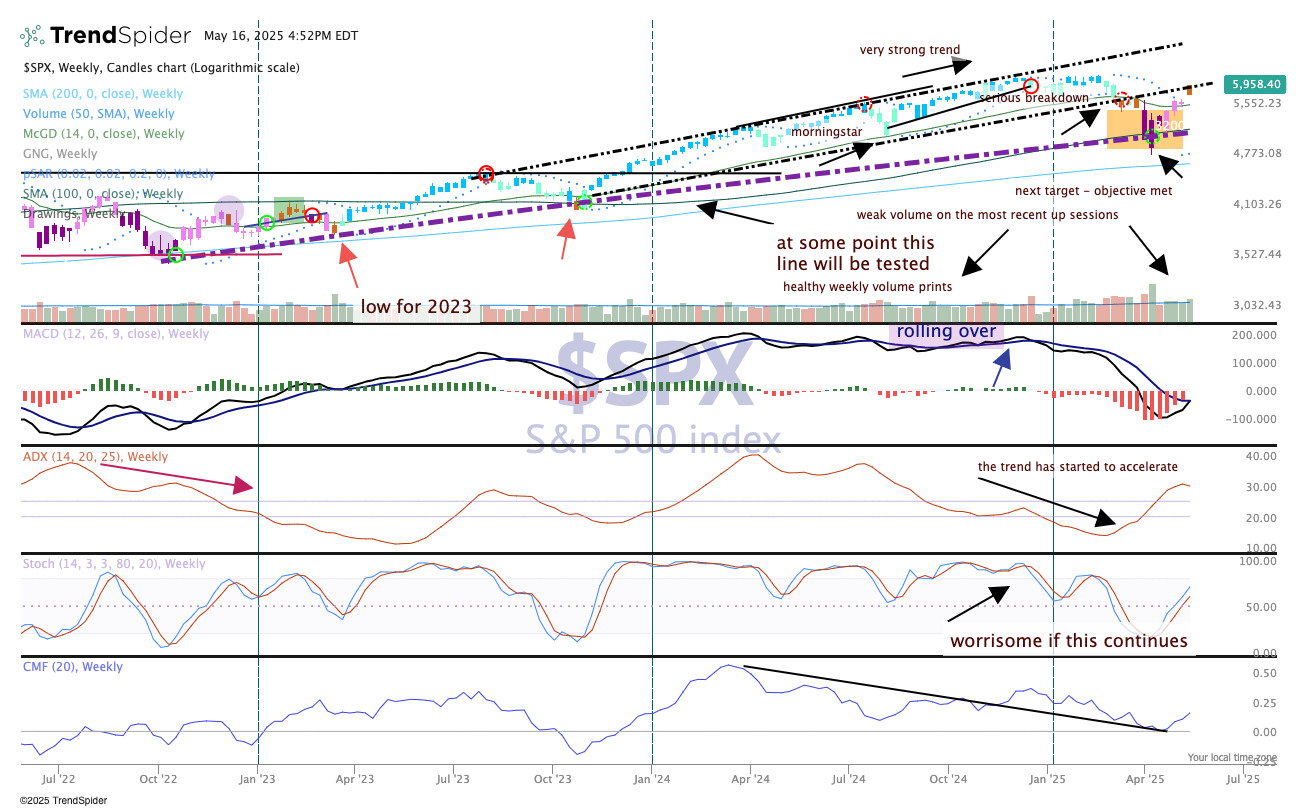
We saw the parabolic SAR (dots in the top of the chart) printed another bullish dot, and the candles finally changed color and show an amber tint, which is neutral. Also notice the uptrend line is now resistance, so if the market does turn down at this time it would not be a surprise, nor if the momentum continues to the upside.
