Charting the S&P 500: Volatile Markets Rattle the Bulls
A rounding top pattern looks bearish for the index.
You've reached your free article limit
You've read 0 of 1 free Pro articles.
It was another tough week for the bulls as the heaviness of the higher market continues to weigh — and that was even before the weekend's major events. While we have seen good relative strength from the small-cap names and the Industrials, the other indexes such as the Nasdaq and S&P 500 have most certainly lagged. That is not to say a rally is not forthcoming, but the evidence we see is of a potential top.
Markets are going to take a hit early Monday after U.S. and Israeli forces struck Iran over the weekend, along with retaliatory fire from Iran. Oil prices have moved up sharply as has volatility, while uncertainty and risk have ramped up so we need to be careful watching lower levels of support.
The best and most important zone is 6790-6805 on the S&P 500. Below there is the December low (mentioned below). Realize that higher volatility simply means wider ranges, which makes investors uncomfortable but also opens up opportunities for those waiting in the wings.
Now, we do not like to call tops or bottoms, and we use the weekly chart as a point of reference for trend changes. That does not necessarily equate to calling a top or bottom, but momentum shifts are long-lasting and very powerful.
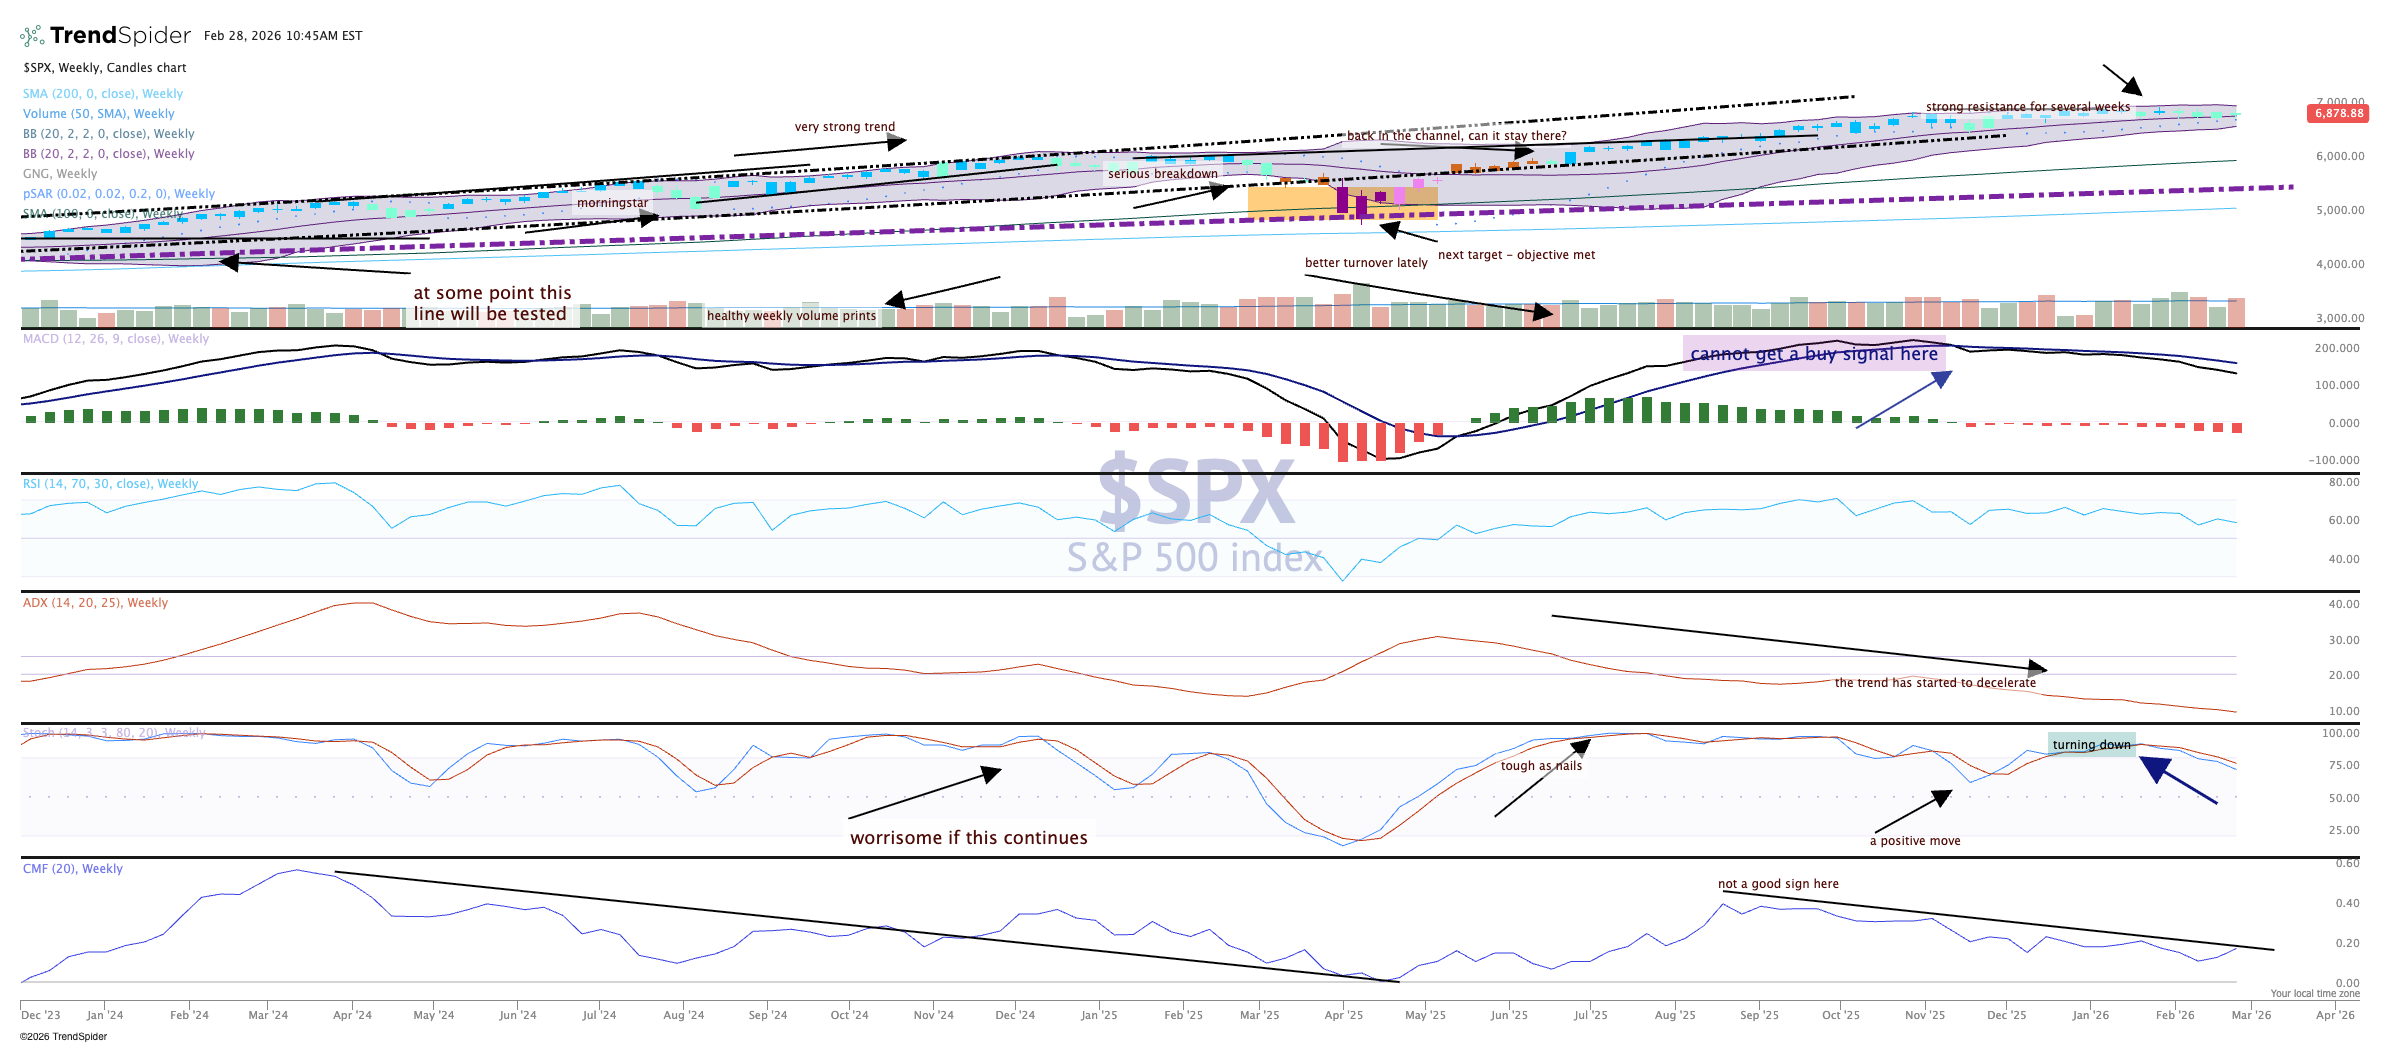
The current chart remains bullish but it is just clinging to that status. One bad week and the floodgates of selling could open wider. The indicators remain bearish and continue to work on dragging down the price action.
Please note the 6720 level on the S&P 500 is the December low. If that spot is cracked it is very bearish and will open the door to much more selling and a likely test of 6500.
