Charting the S&P 500: This Is a Big Week for Deciding the Direction
Stocks failed to rally but may have found a bottom on Friday.
You've reached your free article limit
You've read 0 of 1 free Pro articles.
Last week was a rough one for the bulls as the distribution of the market was in wide view. Remember, distribution is professional selling, which tends to lead toward retail selling and perhaps an avalanche of price drops. We're not talking market crash here, but certainly when the market is falling it feels very bad, especially if it concentrates during an entire week (like this one did).
Indicators are clinging to bullish signals here, but with another negative week that could change. Seasonal trends, however, are now bullish, and what that means is markets "normally" rise over the next six to seven weeks. It does not always work out that way, though, so we cannot just assume the calendar makes the rules.
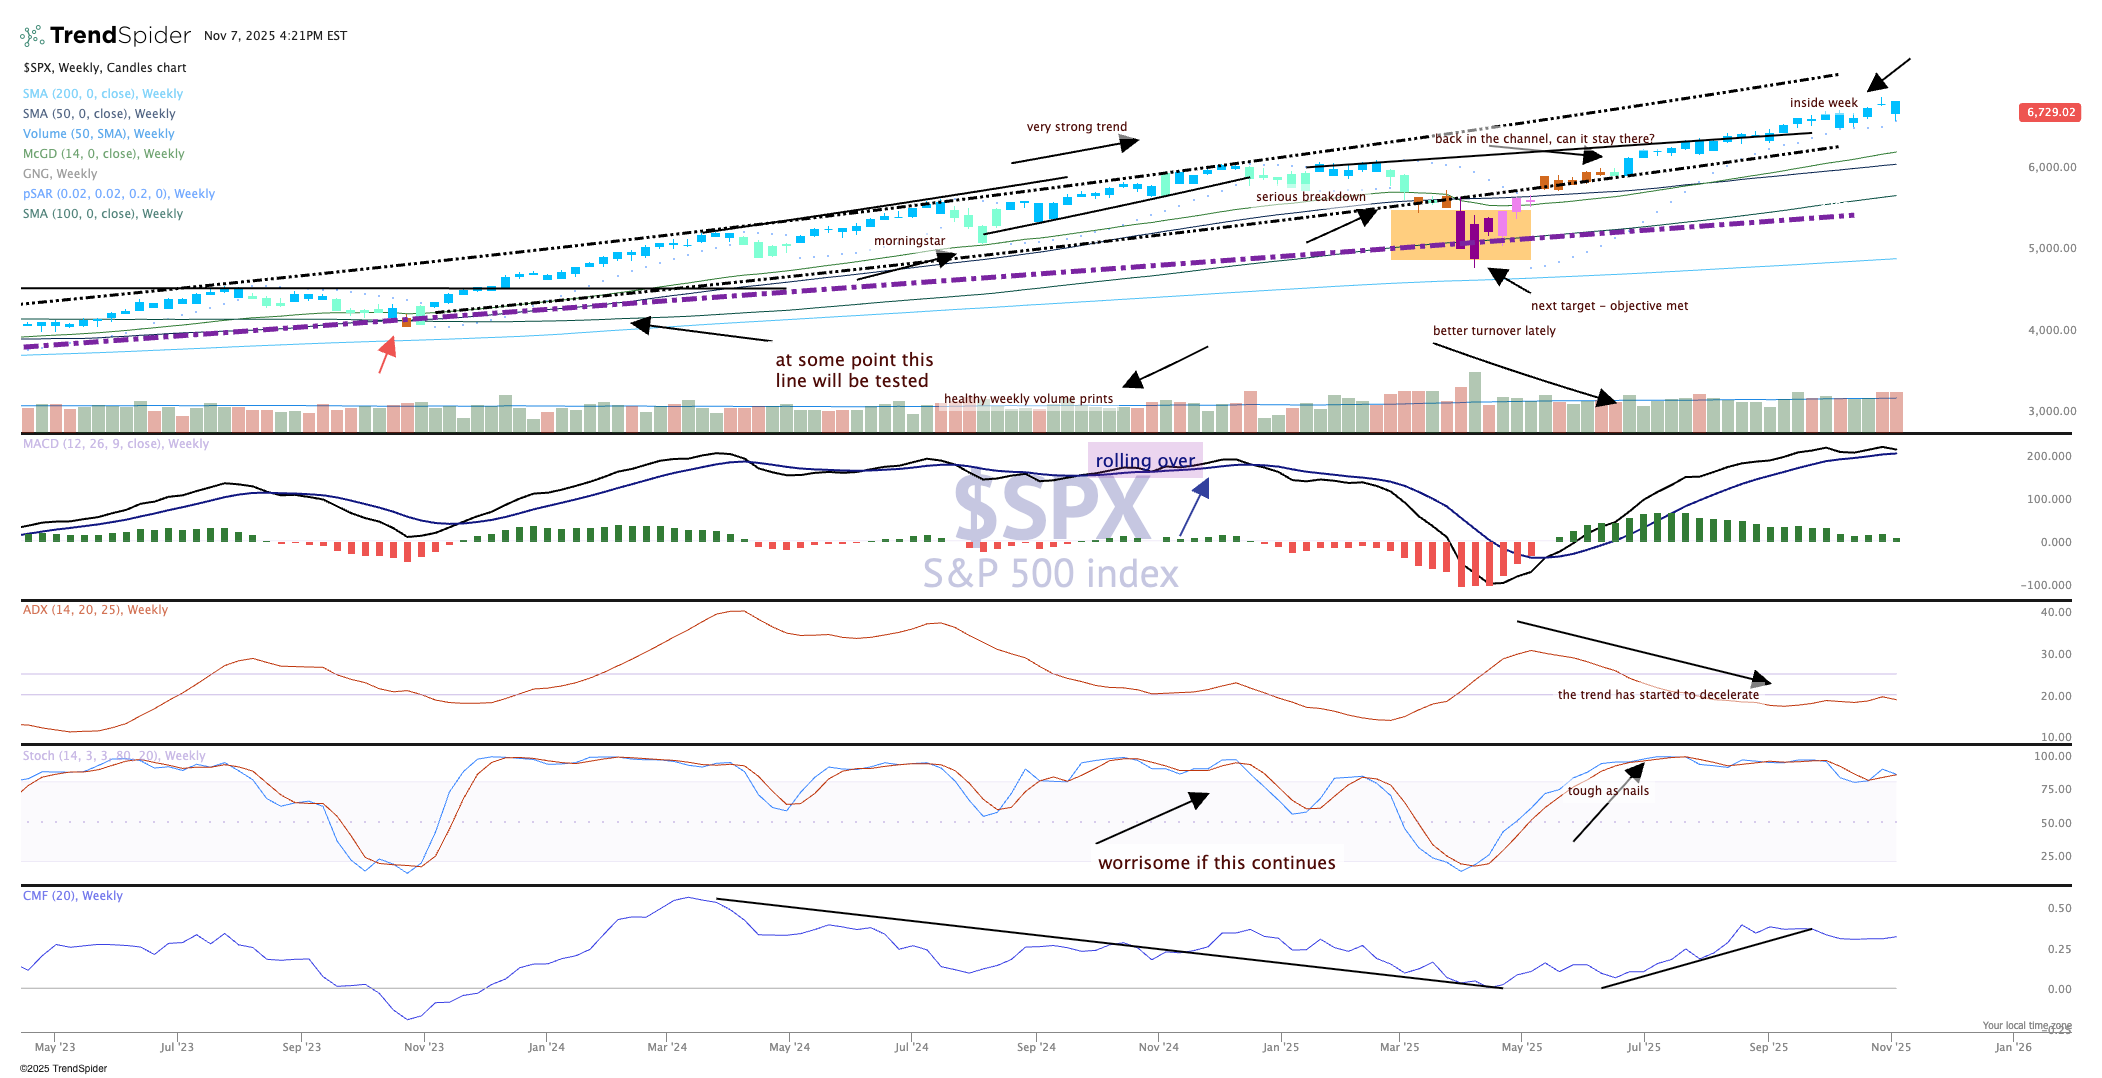
Moving average convergence divergence (MACD) is still bullish and has been since May, but the bullishness is now tepid. Markets have been overbought for awhile now and only need one excuse to sell off (profit-taking is a good one).
Stochastics (momentum) is starting to roll over, and while the parabolic SAR (stop and reverse) remains bullish, this indicator is looking to turn downward for the first time since May.
If the government shutdown is indeed over, the bulls might be able to take the ball back from the bears.
