Charting the S&P 500: Poor Action Translates Into Correction Territory
The bearish theme has been building for weeks.
You've reached your free article limit
You've read 0 of 1 free Pro articles.
In typical fashion the S&P 500 has fallen through support but still retains the long-term uptrend. Of course, that does not make a 4-5% decline make us feel any better, but suffice to say there is plenty of worry and fear from investors and traders. The downside momentum has been building for weeks as we noticed a change in the price action.
Recall a few weeks back we pointed to a yellow flag warning when the indicators moved to bearish (MACD, stochastics) along with the candles turning teal from blue. That indicator told us to be cautiously bullish, and now the tight channel we have drawn at the top has been penetrated and confirmed.
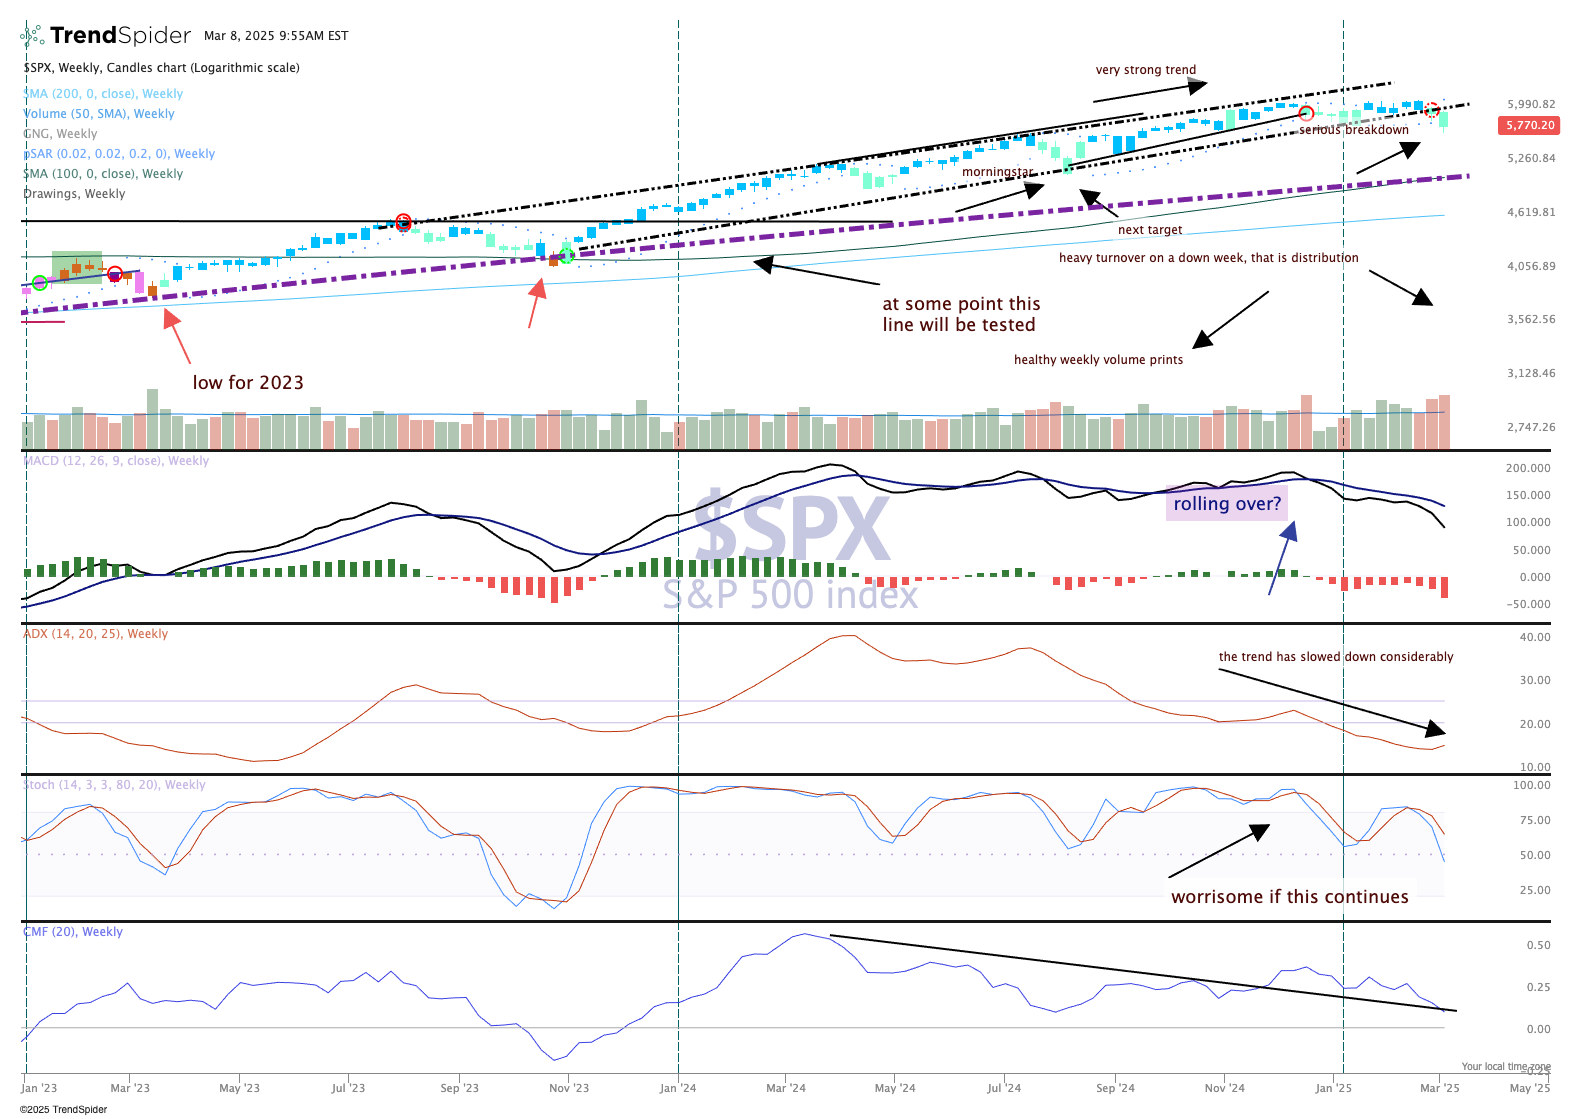
Could the S&P 500 move back into the channel and shock the bears? Of course, anything is possible, but following the momentum and the trend is often the higher probability bet.
As we know, markets move swiftly when they are going down. The MACD (moving average convergence/divergence) made a leg down this past week, and ADX is moving up as well, signaling the trend is strong (but not telling us which direction). Money flow has been leaking badly the last few week and remains challenged.
Next up are some lower levels such as 5600 and then 5450 or so, and if the bears really get serious that lower trend line (purple dotted line) comes in around 5240.
