Charting the S&P 500: Market Confronts 'Blatant' Seasonality and Complacency
Stocks start off the new month today and there is worry as September is often the worst month of the year.
You've reached your free article limit
You've read 0 of 1 free Pro articles.
There has been no stopping this bull market since it started charging higher in mid-April. There have been a series of higher highs, higher lows AFTER it tested that long-standing purple trend line (in the top chart), but now the weight of evidence is on the bulls to continue this run. The challenge here is to get past September with as little damage as possible, but the chances of a sharper downturn are much greater than in August.
September is historically as the worst-performing month of the year for the stock market. Statistically that is true, but there are always exceptions. Further, when most are looking for a down month to occur it rarely happens that way.
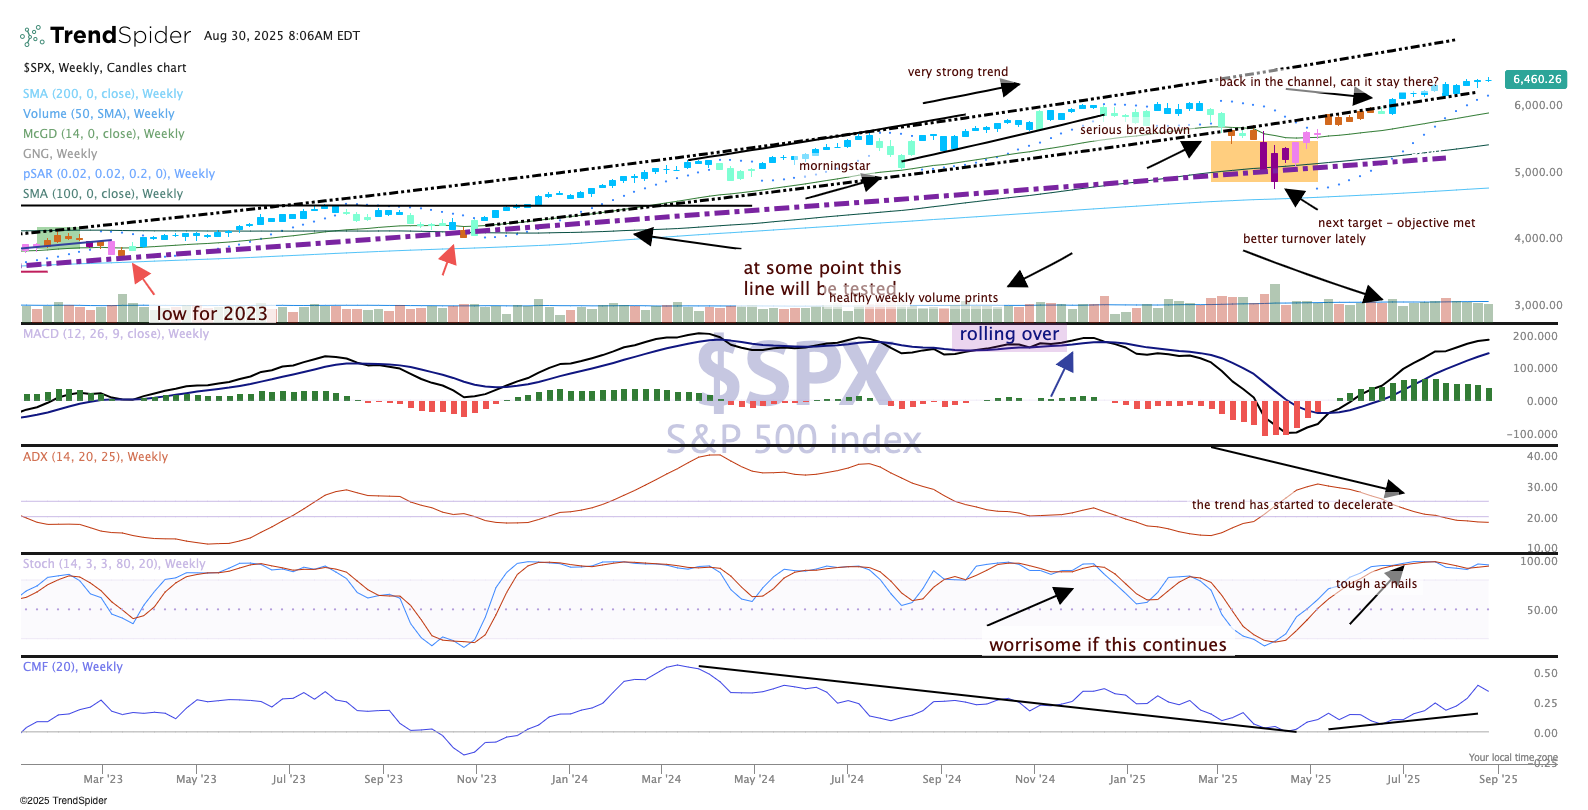
Notice in the top chart how the S&P 500 chart is just drifting sideways with very small candles. That is reflective of low volatility; the VIX remains subdued under 15%. Therefore, the expectation for a large move up or down is nil, and that is what we call a complacent attitude. The market is primed and "set up" for a much larger pullback because frankly, nobody expects one!
Indicators remain bullish, though, and the price chart remains bullish, too. So while seasonal trends and complacency are blatant, we must always trust the price chart and indicators to give us the most accurate information. Bullish until it's not.
