Charting the S&P 500: Index Starts to Feel the Pain as Bulls Hold Their Breath
It was only a few days ago the big index closed at an all-time high, but now a false signal sends an ominous sign.
You've reached your free article limit
You've read 0 of 1 free Pro articles.
Is the stock market still bullish? One might be skeptical after Friday's thrashing. Stocks were thrown out indiscriminately, sold without reservation. This puts the S&P 500 index back near the 6000 level, a very familiar spot as we see from the chart in the top pane. Many of the weekly candles in place hover near this mark and have for some time (since November).
A shot across the bow? Quite possibly, unless the dip buyers return with a vengeance. This market is not even close to being oversold yet, hence if buyers don't show up there is more downside to go.
What's it all mean?
Well, we can certainly account for this 6000 level as meaningful as it works like a magnet, drawing prices to it on a consistent basis. The bulls would like this to work in their favor, the magnet rising up like a moving average. But as we see, the MACD (moving average convergence/divergence) is not showing that sensitivity right now, in fact it is flashing a sell signal at the moment. The stochastics have also rolled over, with no momentum to the upside while the trend has slowed down considerably according to the ADX (pane 3).
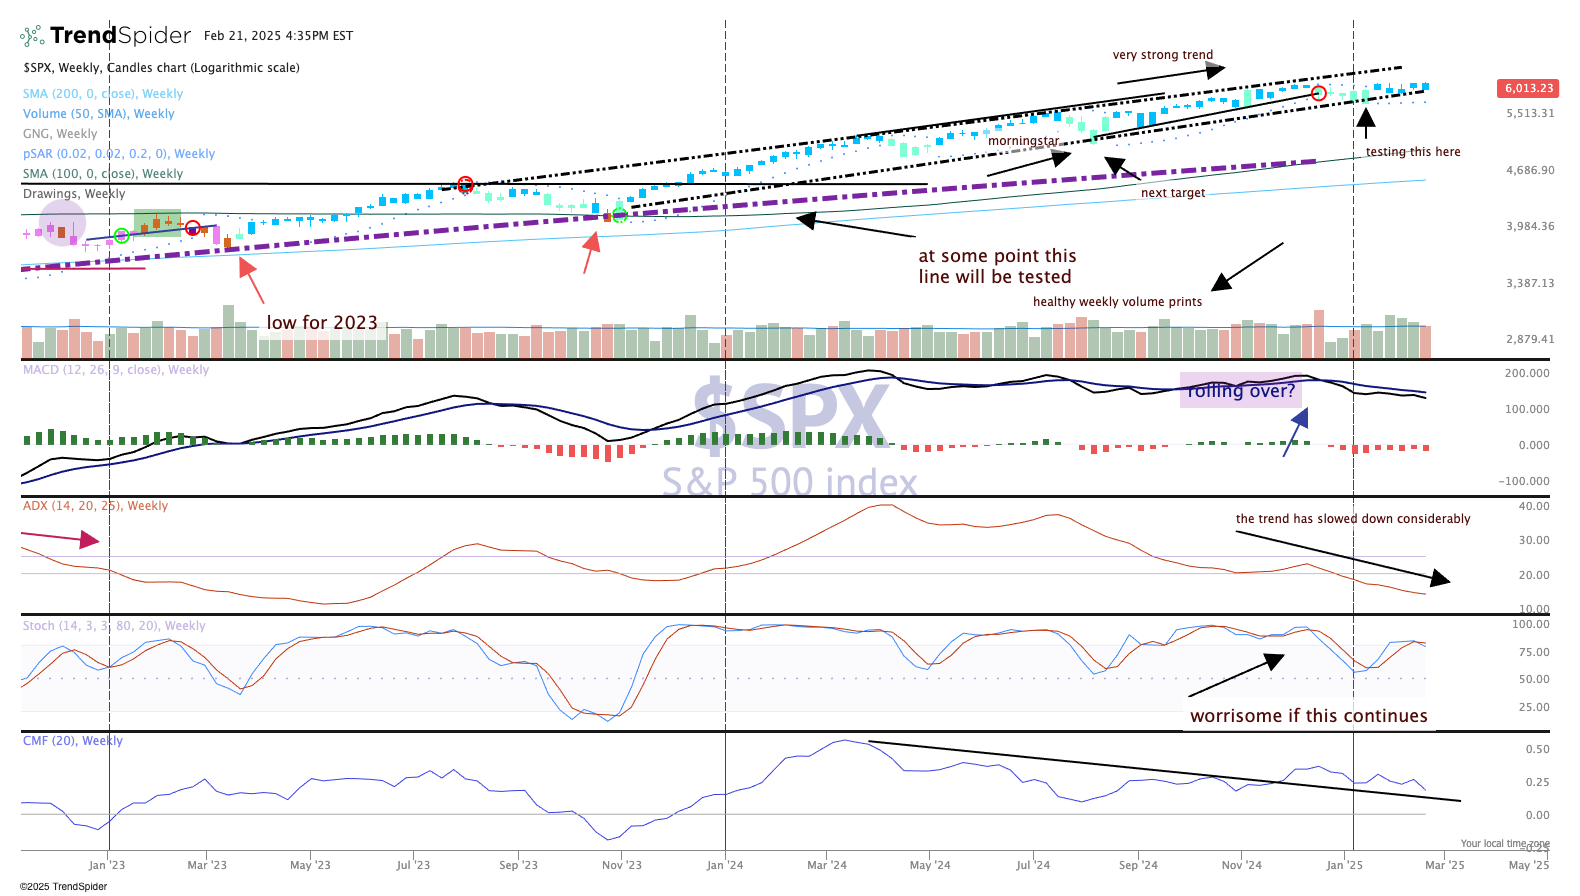
As the S&P 500 rests on the lower end of the channel, the bulls are holding their breath now hoping that channel is not broken. Otherwise, there are some lower targets that can easily be probed, and with it the uptrend will have ended.
