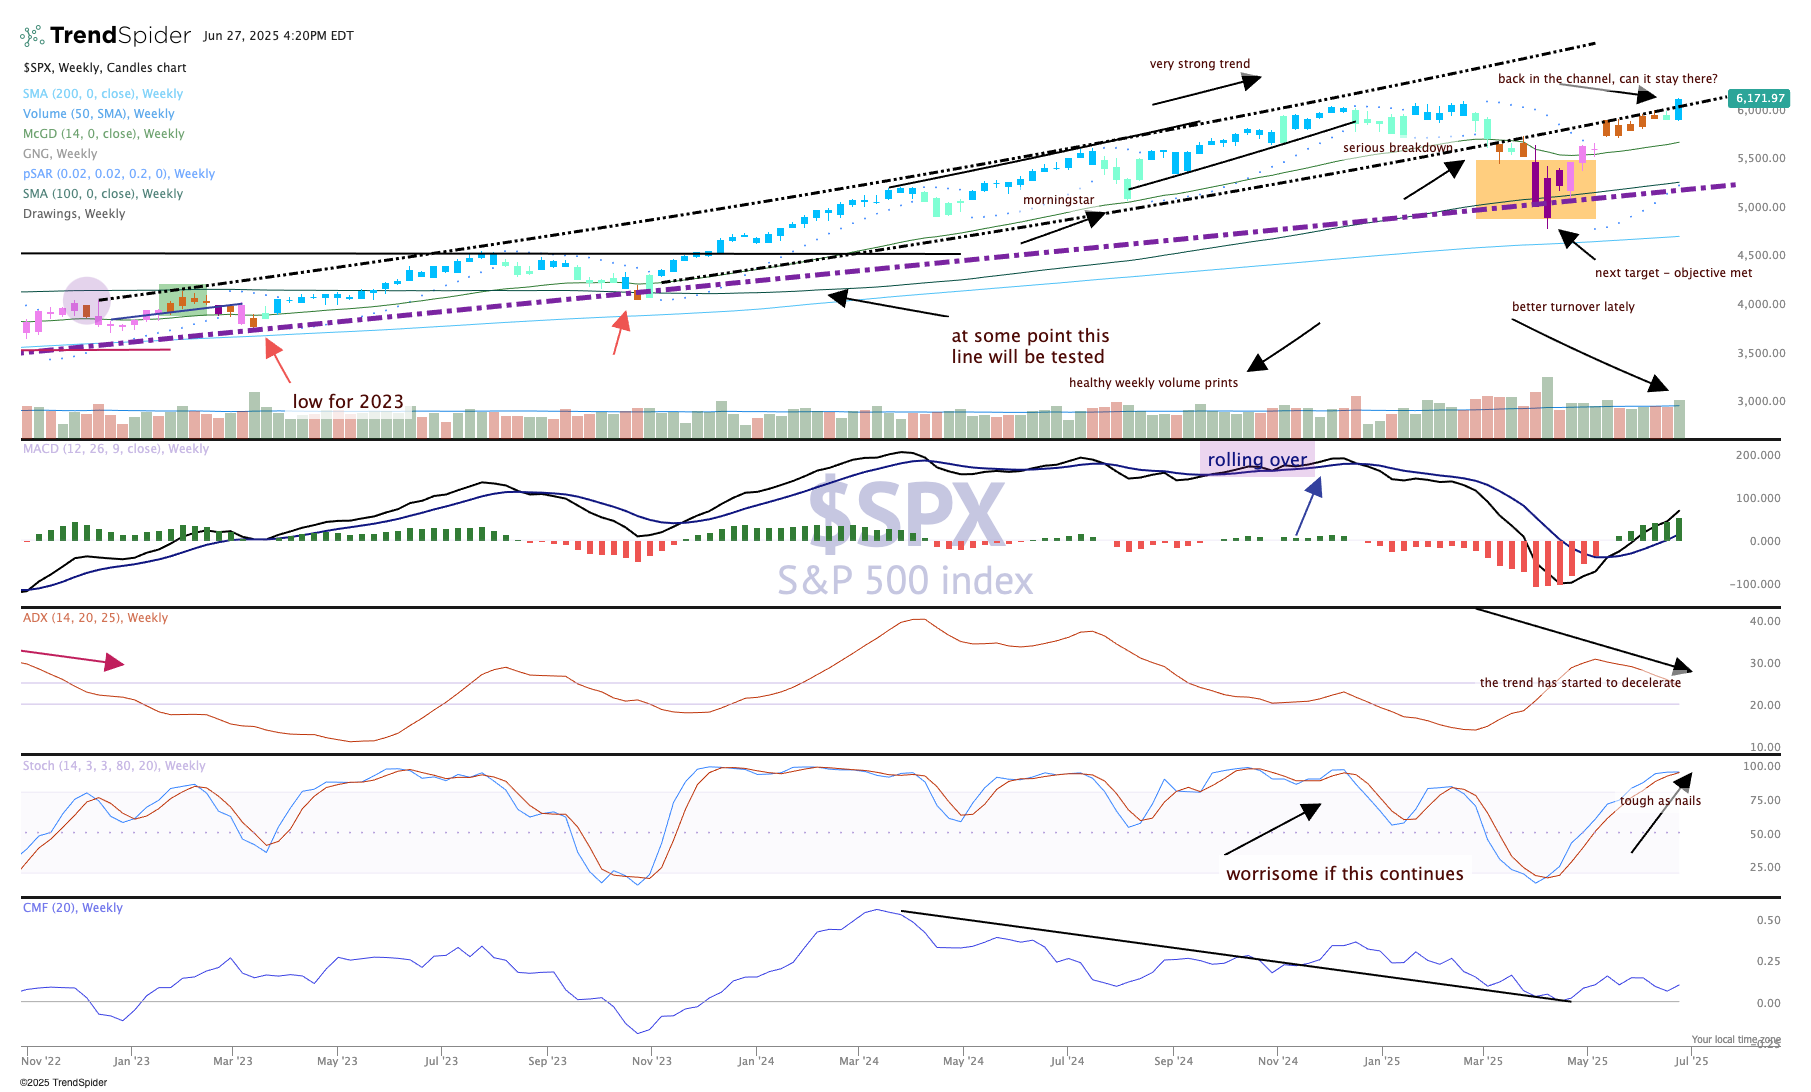
Charting the S&P 500: Finally, a Breakthrough!
With new all-time highs printed, the chart shows bullish characteristics.
You've reached your free article limit
You've read 0 of 1 free Pro articles.
Who knew that a blast through that upward sloping channel would bring new all-time highs? Well, actually we did here — as we have been preaching it for weeks. Once penetrated it was very likely to reach for an all-time high.
Now, while the celebrations get started we won't necessarily get too giddy just yet. Why is that? Well, as we all know a big move like we had this past week requires some follow-through, and that is a tall order considering now the markets are all pretty much overbought at this point.
Further, a short week of trading ahead is going to complicate matters. Oh sure, the price action is positive and constructive but knowing the holiday-shortened week is upon us there may be very thin action into the half day of trading this coming Thursday. We'll take what we can get, though, as the indexes advanced smartly and closed near session highs after a swoop lower late on Friday.
Dip buyers did their thing and brought the bulls back to life. Indicators for the S&P 500 remain bullish, with MACD (moving average convergence divergence) and parabolic SAR (stop and reverse) on a buy signal. Note, the candle turned blue this week for the first time since early March, and if there is a repeat blue candle this week then it is a market in bull mode.
