Charting the S&P 500: Cracks Show as Volatility Takes Center Stage
Big moves are happening to the downside, but expect even more large moves up and down for the foreseeable future.
You've reached your free article limit
You've read 0 of 1 free Pro articles.
 Volatility
The challenging part of understanding this market is knowing when to ease up on the throttle and when to step on the gas. As long-term investors, we are trained to move in hard when the market dips and take some profits when it rips. But as we know, market moves are not linear, nor is it easy as it sounds.
The high probability trade is to find that "low risk entry" point but it is not always apparent. As such, we could get stuck in a steep downtrend that makes every attempt to safely buy a dip look like a knife-catching exercise.
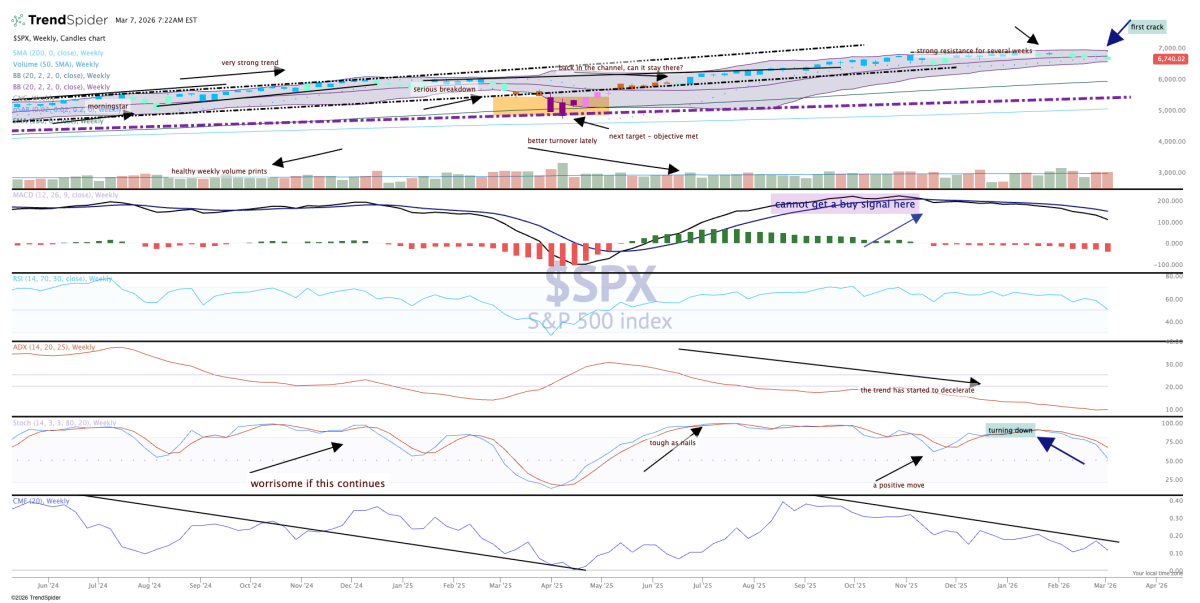
The weekly S&P 500 chart continues to show some cracks. Indicators are bearish, but the chart is clinging to a buy signal. Closing below the 20-week moving average this past week was a bit of a shocker, the first time since last May. That is nearly 10 months of performance above a key support level.
Now, the first move down is not always fatal to the trend but a confirmation candle this week could be damaging. The odds seem to favor some wide moves with VIX up at 29%, but eventually some big moves down will trigger a reversal to the upside. Be ready for anything.
More Pro Portfolio:
- Selling Off Some Public Safety Shares After Big Gain
- 25 Signals Across 9 Investing Themes
- Weekly Roundup: S&P Drops 2%, Portfolio Barely Blinks. Here's Why.
At the time of publication, TheStreet Pro Portfolio had no positions in any securities mentioned.
