Charting the S&P 500: Can the Index Rise for a Fourth Straight Year?
While it may seem like a stretch, there is precedent.
You've reached your free article limit
You've read 0 of 1 free Pro articles.
2025 is now in the books and with it a third straight year up. Over that three-year stretch the S&P 500 has gained nearly 70%, well above historical averages. But over the last three decades the returns have been enormous overall, and the average gain of the index has been moving higher. In fact, the average return is closer to 10% per year dividends included (nominal), where as inflation-adjusted returns are more like 7%.
There have been three instances since 1992 when the stock market has risen four times in a row or more (twice it was nine times!). Some see the current market as overvalued, but it is hard to see it that clearly.
In a post mortem of 2025, there is not much to look at other than the highly volatile period in the spring, with a high-intensity selloff and extreme run in volatility, but the bulls got re-engaged after a mini bear move. As we set up for 2026 some of the themes are the same but we could have more volatility too, as uncertainties abound.
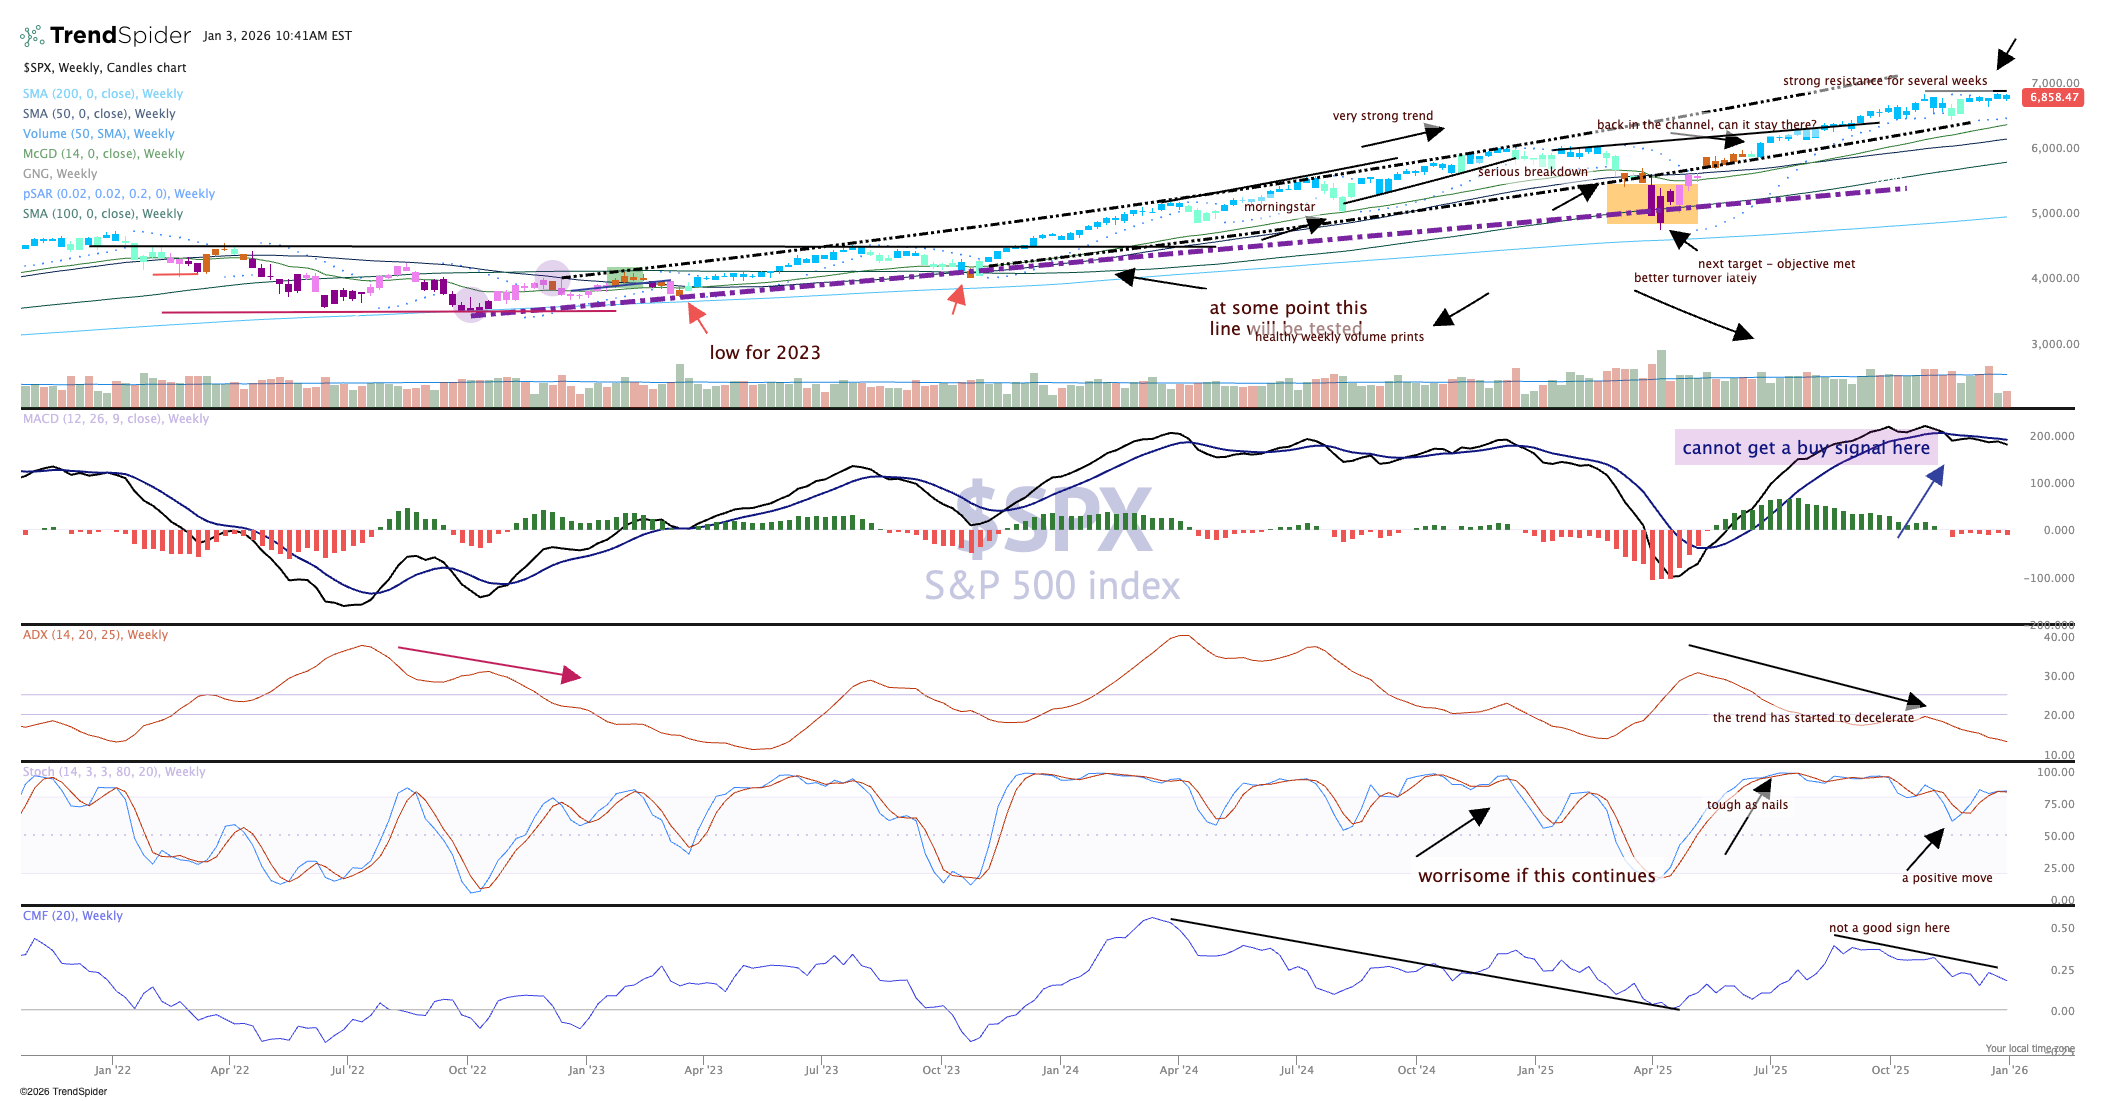
The chart of the weekly S&P 500 has not changed much. Stochastics remain somewhat bullish while the moving average convergence divergence (MACD) is still heading down, mostly due to the stall in the price action.
The candles are still blue and are range bound; we could almost say here the weekly chart is building a coiled spring, which would eventually resolve in the direction of the trend (bullish).
