Charting the S&P 500: Bulls Are Losing Their Edge
Stocks look vulnerable to some downside action — and that might be healthy.
You've reached your free article limit
You've read 0 of 1 free Pro articles.
A strong start to February may have lost its buzz, and that comes on the heels of a very hot month of January. Stocks are pulling back and may be looking to break the tight channel we have drawn in the top pane of the chart below.
There's no fear from the bulls, however, as the candles are blue and portray a bullish condition on the GoNoGo composite of indicators. Momentum is starting to wane, though. Notice the stochastics, which had been strong for the past few weeks but is starting to roll over. That would be a yellow flag caution sign.
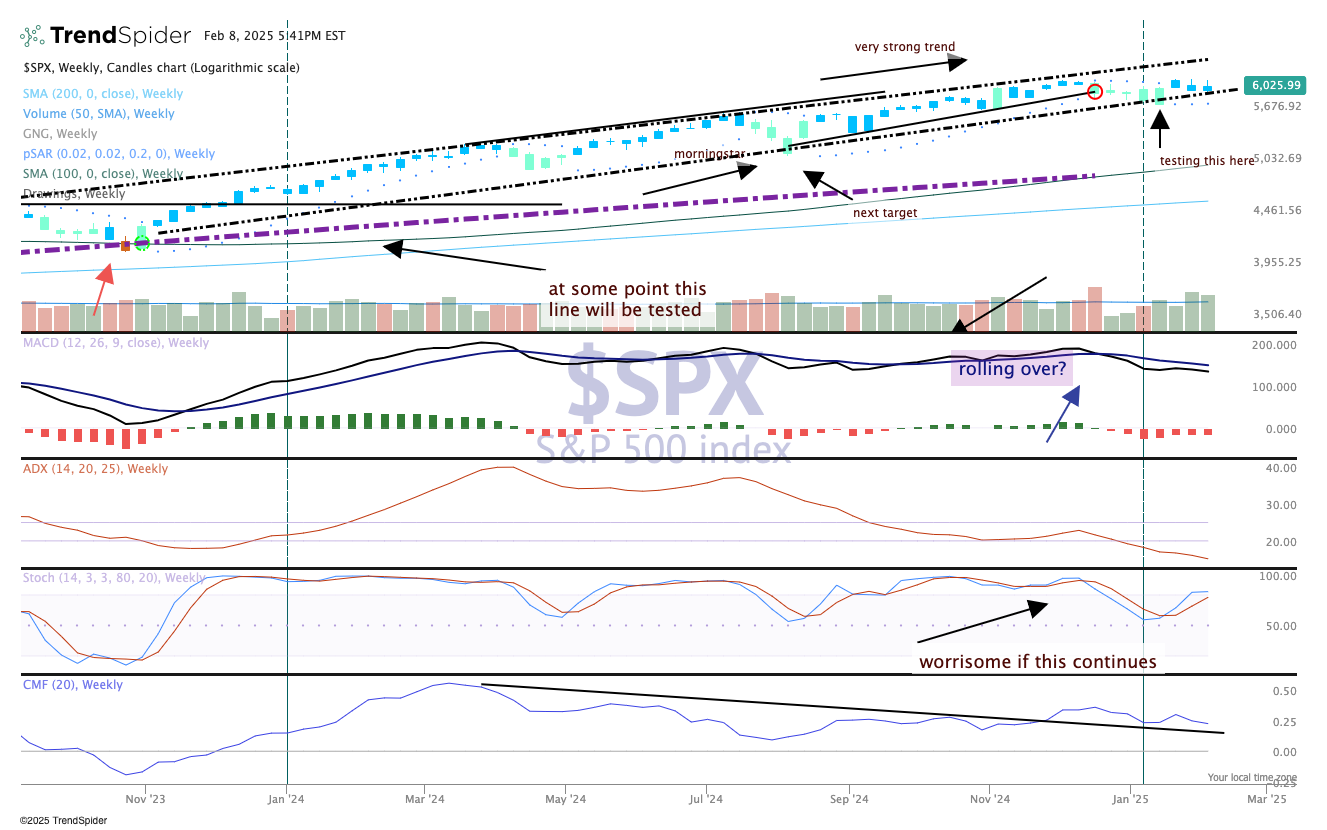
In the bottom pane, money flow is starting to weaken, but it is still in positive territory. MACD (moving average convergence/divergence) is positive but weakening.
So, we have indicators that are sharing the same characteristics of the price chart, sliding lower. Volume is picking up as well, but with lower highs and lower lows the last two weeks we should recognize the bulls are losing their edge.
