Charting the S&P 500: Bears Make Their Biggest Move Yet
Even as the market is oversold there seems to be more selling to come.
You've reached your free article limit
You've read 0 of 1 free Pro articles.
 aggressive bull fighting furious bear with stock market image in the background
Chalk up another win for the bears this past week as the trend down continues. Bulls at this point are probably very frustrated at the action.
Take Friday for instance, where it seemed early on a nice rally was about to ensue, recovering a good portion of Thursday's heavy losses. But once the buying finished up (after the first hour or so) the bears re-claimed the ball and ran with it.
Stocks finished the week at their worst levels, lower than Monday's radical move down and eventual rebound. All in a week's work.
What is troublesome here is the pressure being applied each time the market tries to rally. This is a bearish quality even if nobody wants to accept it. Where/when it stops nobody knows, but the indicators for this weekly chart are certainly not inspiring the bulls to step up yet.
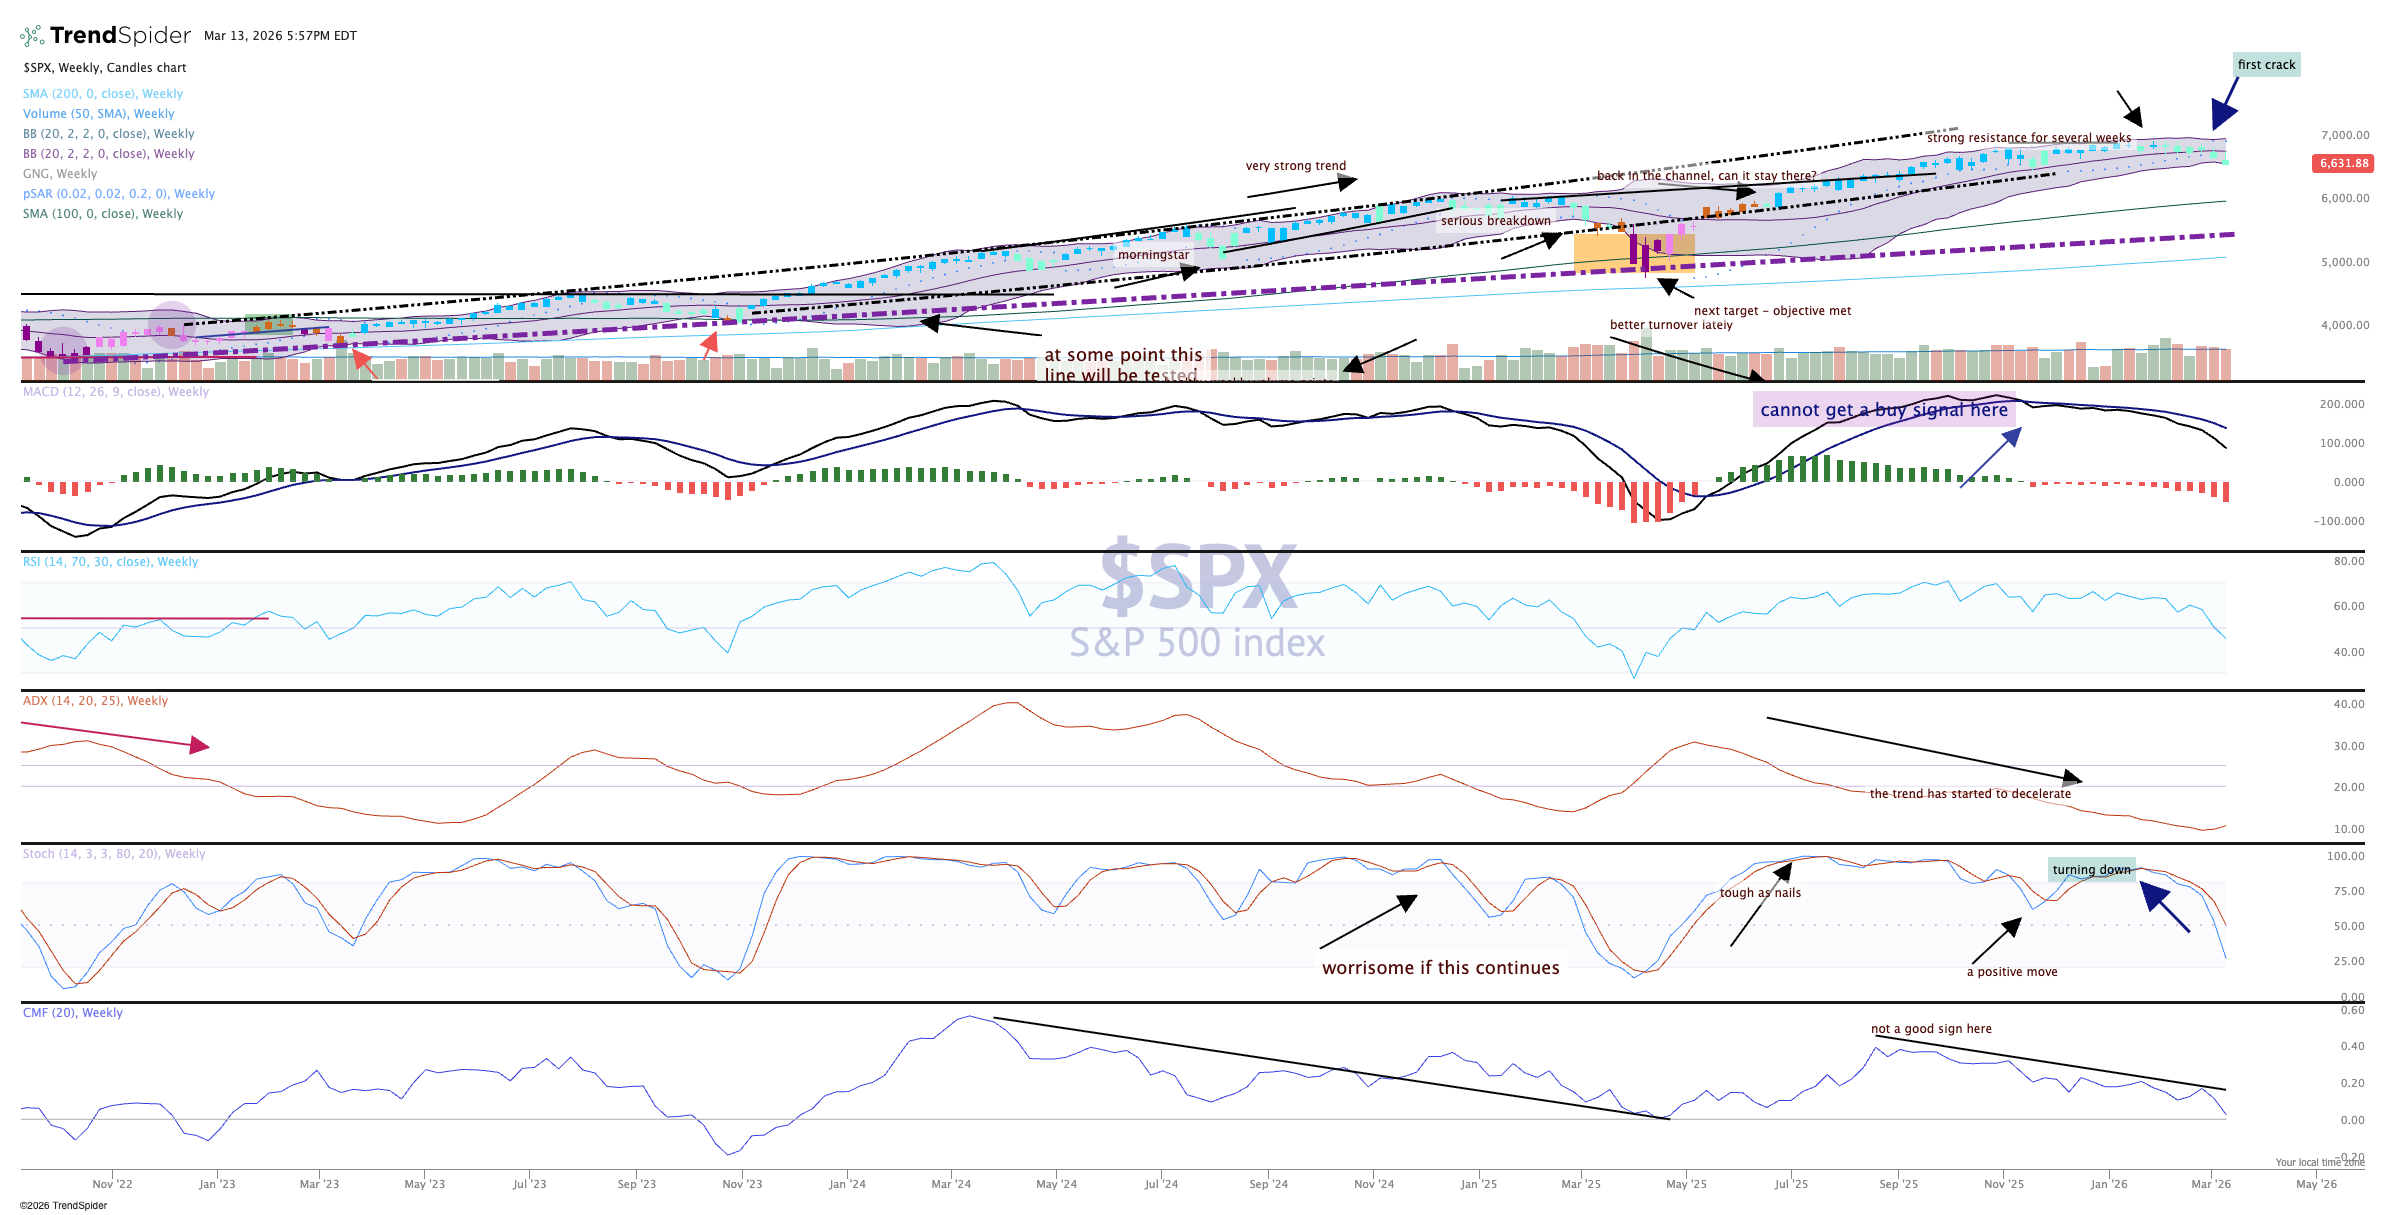
Though the price action shows a teal candle, which is cautiously bullish, we suspect it changes soon to neutral. Breaking and closing below the lower Bollinger band (top chart) is not a good move.
Money flow has turned lower and is just about negative, while moving average convergence divergence (MACD) rolled over weeks ago.
There's nothing positive on this chart but a bounce is due.
