Charting the S&P 500: Bearish Action May Lead to More Downside
Here's what to watch this week after a barrage of selling Friday.
You've reached your free article limit
You've read 0 of 1 free Pro articles.
We have not seen this kind of selling in quite some time, and it was again caused by news from trade policy. Perhaps 100% tariffs on Chinese items starting November 1 was enough to get traders/investors to the sidelines. After all, we have had no inkling of a deal between the U.S. and China lately and that has to make traders rather nervous. With such strong market gains in 2025 you have to think it won't take much to rattle some cages.
As it turns out, the S&P 500 chart remains bullish even after the massive swing lower on Friday. It was a huge turnaround from midday, and by the end the day indexes were racking up 1-2% losses on the session. Indicators are starting to roll over, but we'll give them another week or two before we pass judgment.
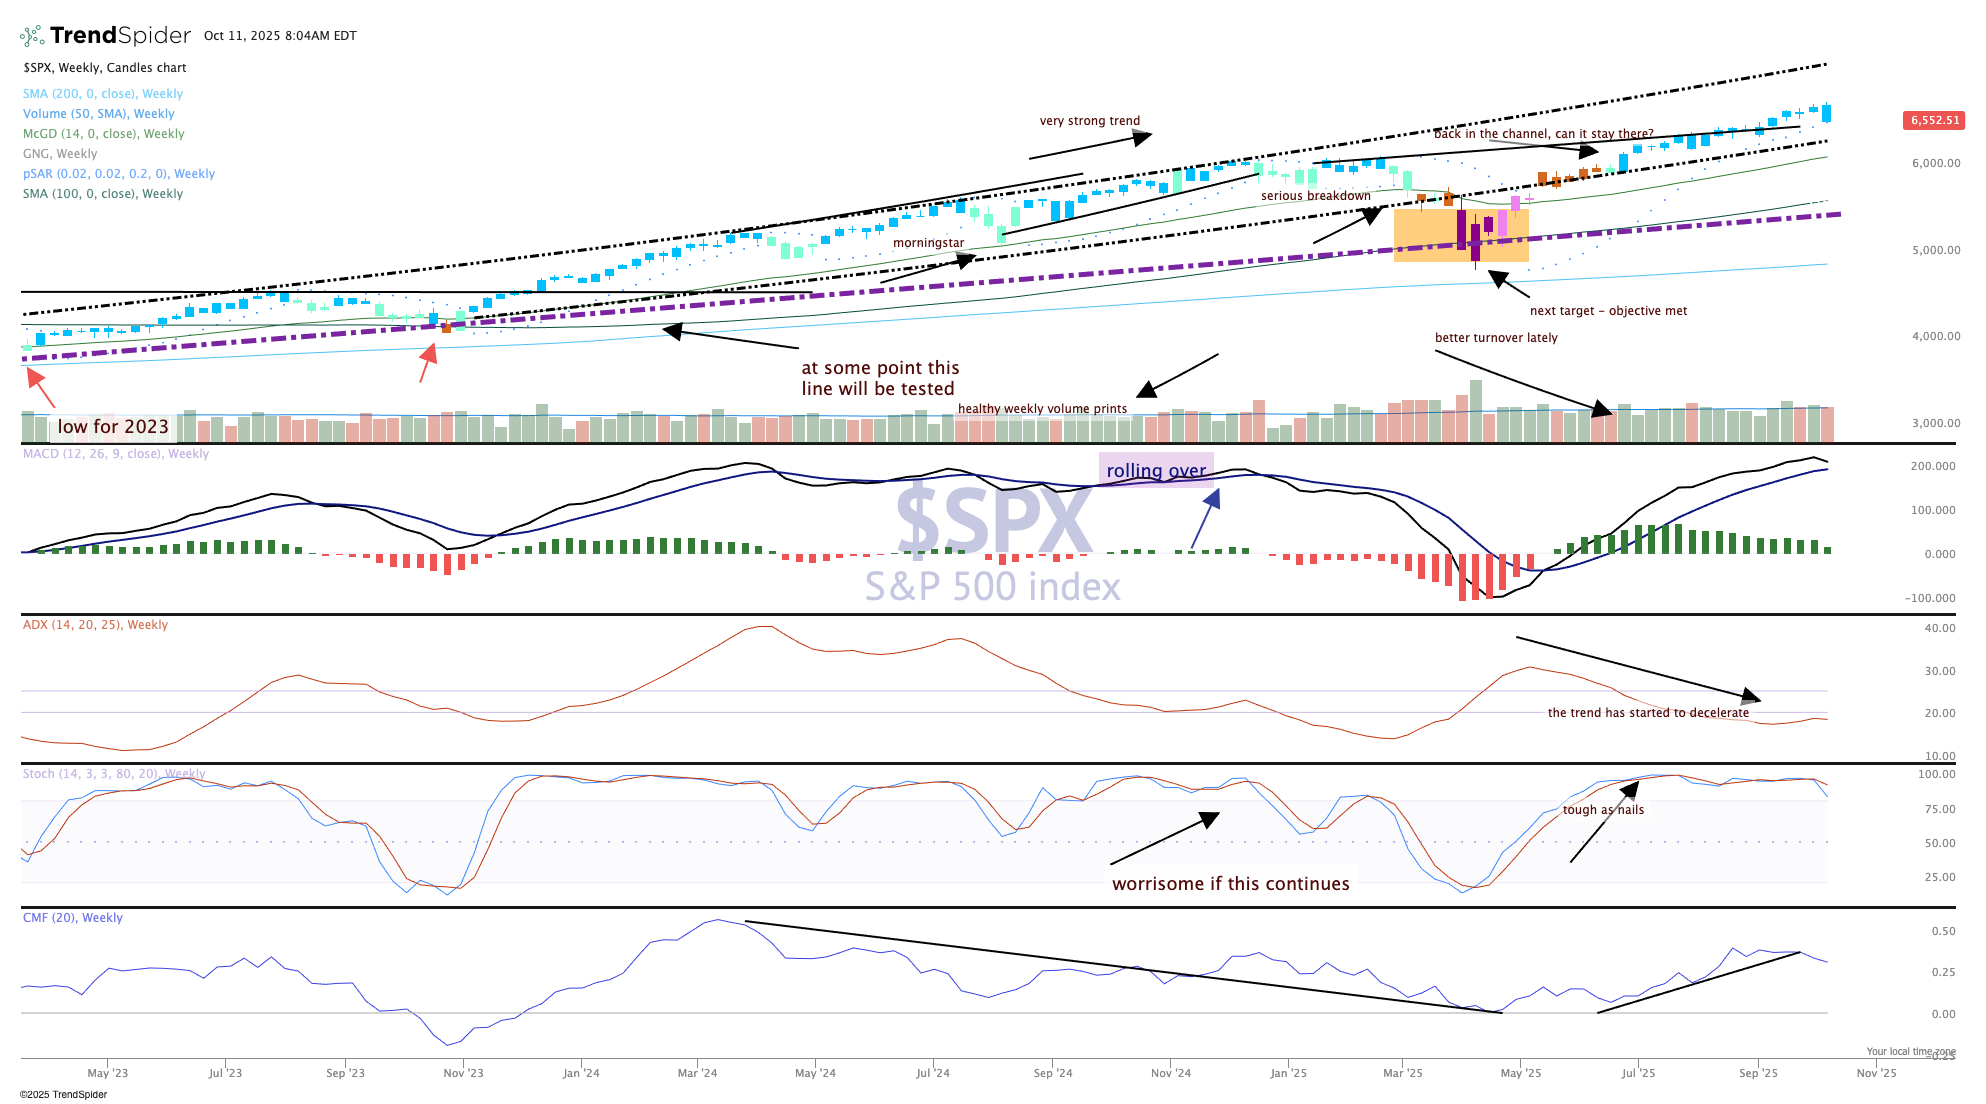
The price chart shows the indexes are stuck in the middle of the channel, but this last bar of lower highs and higher lows is called an outside week, similar to what we had in July and June. It is not damaging if the low stays in place this week and the indexes can advance.
But as the uncertainties arise (and Friday showed there is at least one) there is a need for protection, at the very least taking risk down to more manageable levels. There will be a time for taking more risk, but now is probably not the moment even if seasonal trends are bullish. That could be delayed a bit longer.
