Charting the S&P 500: A Respite for the Downtrend, But...
Here's the best-case scenario if you're a bull.
You've reached your free article limit
You've read 0 of 1 free Pro articles.
While many would like to believe the bullish trend was going to re-exert itself, the bears had other ideas. To be sure, the candles have now tepidly turned bullish, a cautious signal (teal on the GoNoGo indicator in the top pane). But the other indicators remain bearish and that gives us some pause here.
The best-case scenario if you're a bull would be some sideways action, almost boring to a degree but holding the prior week's low on the S&P 500 at 5500. There are plenty of support levels below there to test, as we see in the weekly chart the 5100 level is just begging to be touched (broken purple trendline).
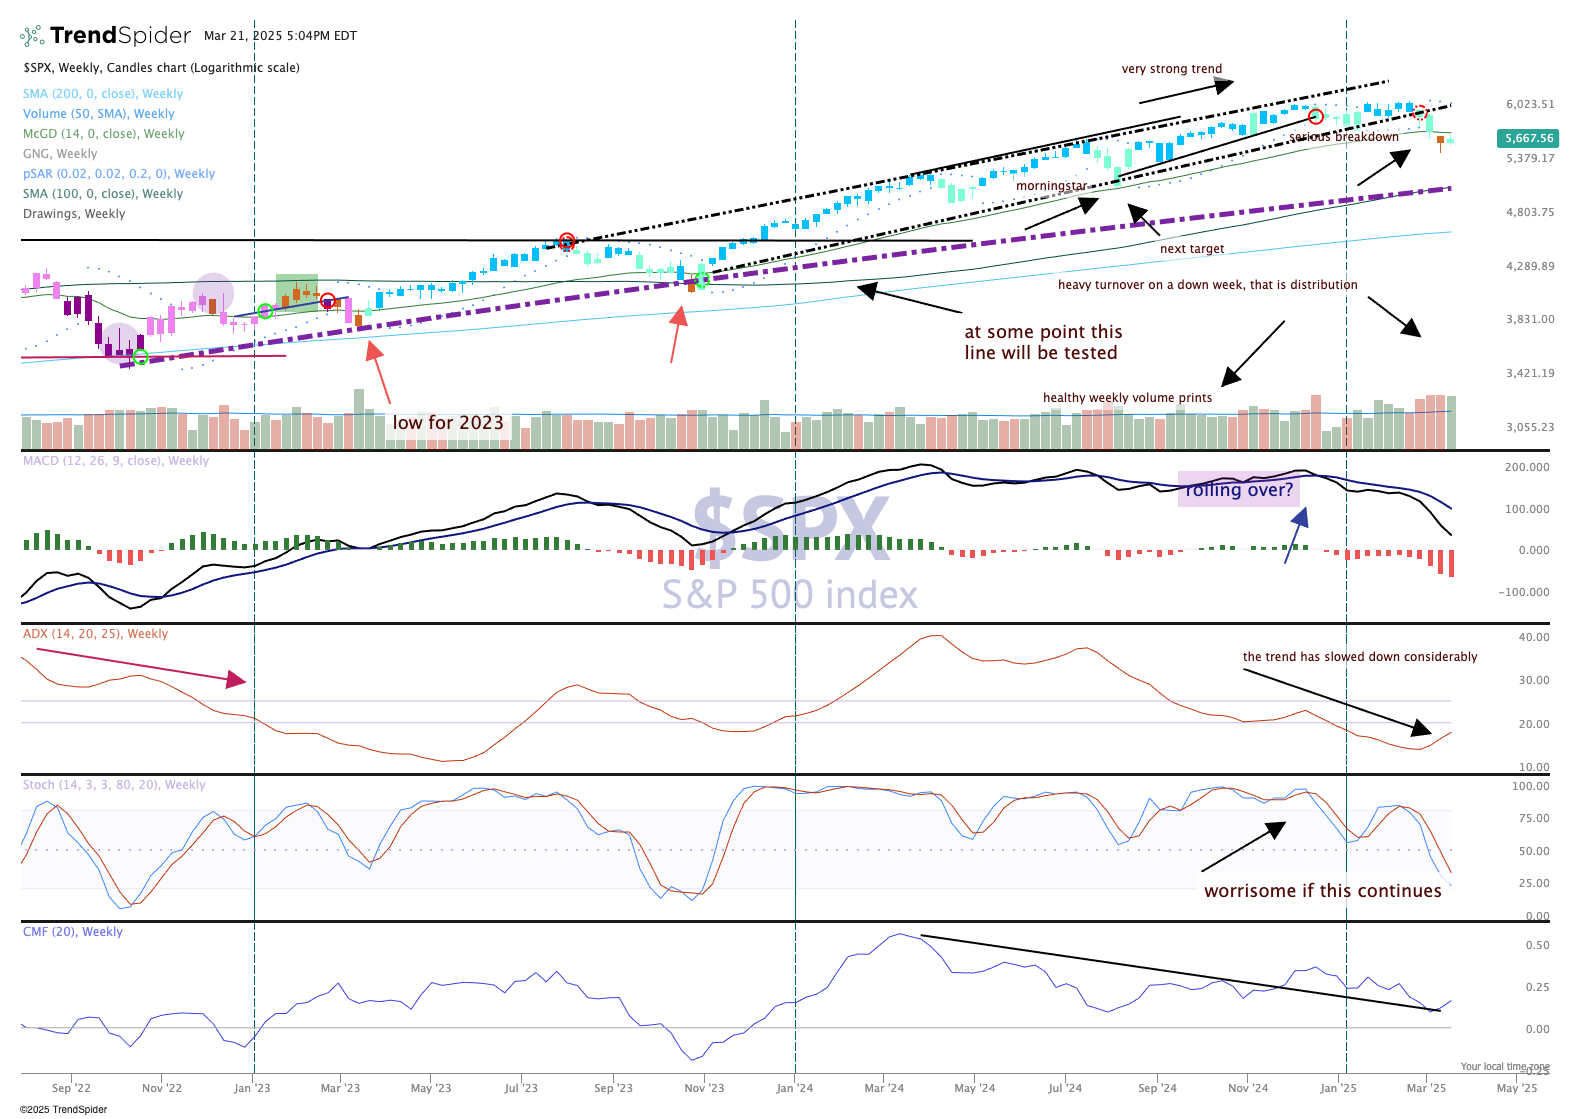
Money flow curiously moved up this past week but the MACD (moving average convergence/divergence) and stochastics are solidly bearish. It might take a month or longer for these indicators to turn bullish, and as we approach earnings season that might be a tall order.
