Charting the S&P 500: A Rally Just in Time for Santa's Ride
A mid-December dip was painful but it is likely finished.
You've reached your free article limit
You've read 0 of 1 free Pro articles.
It was a slightly down week for the S&P 500 but it could have been worse without the stick save from Friday. The Industrials and small-caps fared much worse than the other indexes for the first time in weeks, hinting maybe the rotation is back on to the Mag 7 names and other mega-caps. Regardless, the S&P 500 is poised for a late-year run at the all-time highs, which lately has been difficult to achieve.
The index has been trading in a rather tight range for weeks. We can see it started where we have the big arrow at the top of the chart.
A range-bound market is frustrating to both bulls and bears, who want to see a breakout in one direction or the other. The dip buyers, though, like this sort of activity, finding strong support levels and taking advantage of lower prices. But that trick does not always work and eventually the weight of the market may come down for whatever reason, and those dip buyers get burned.
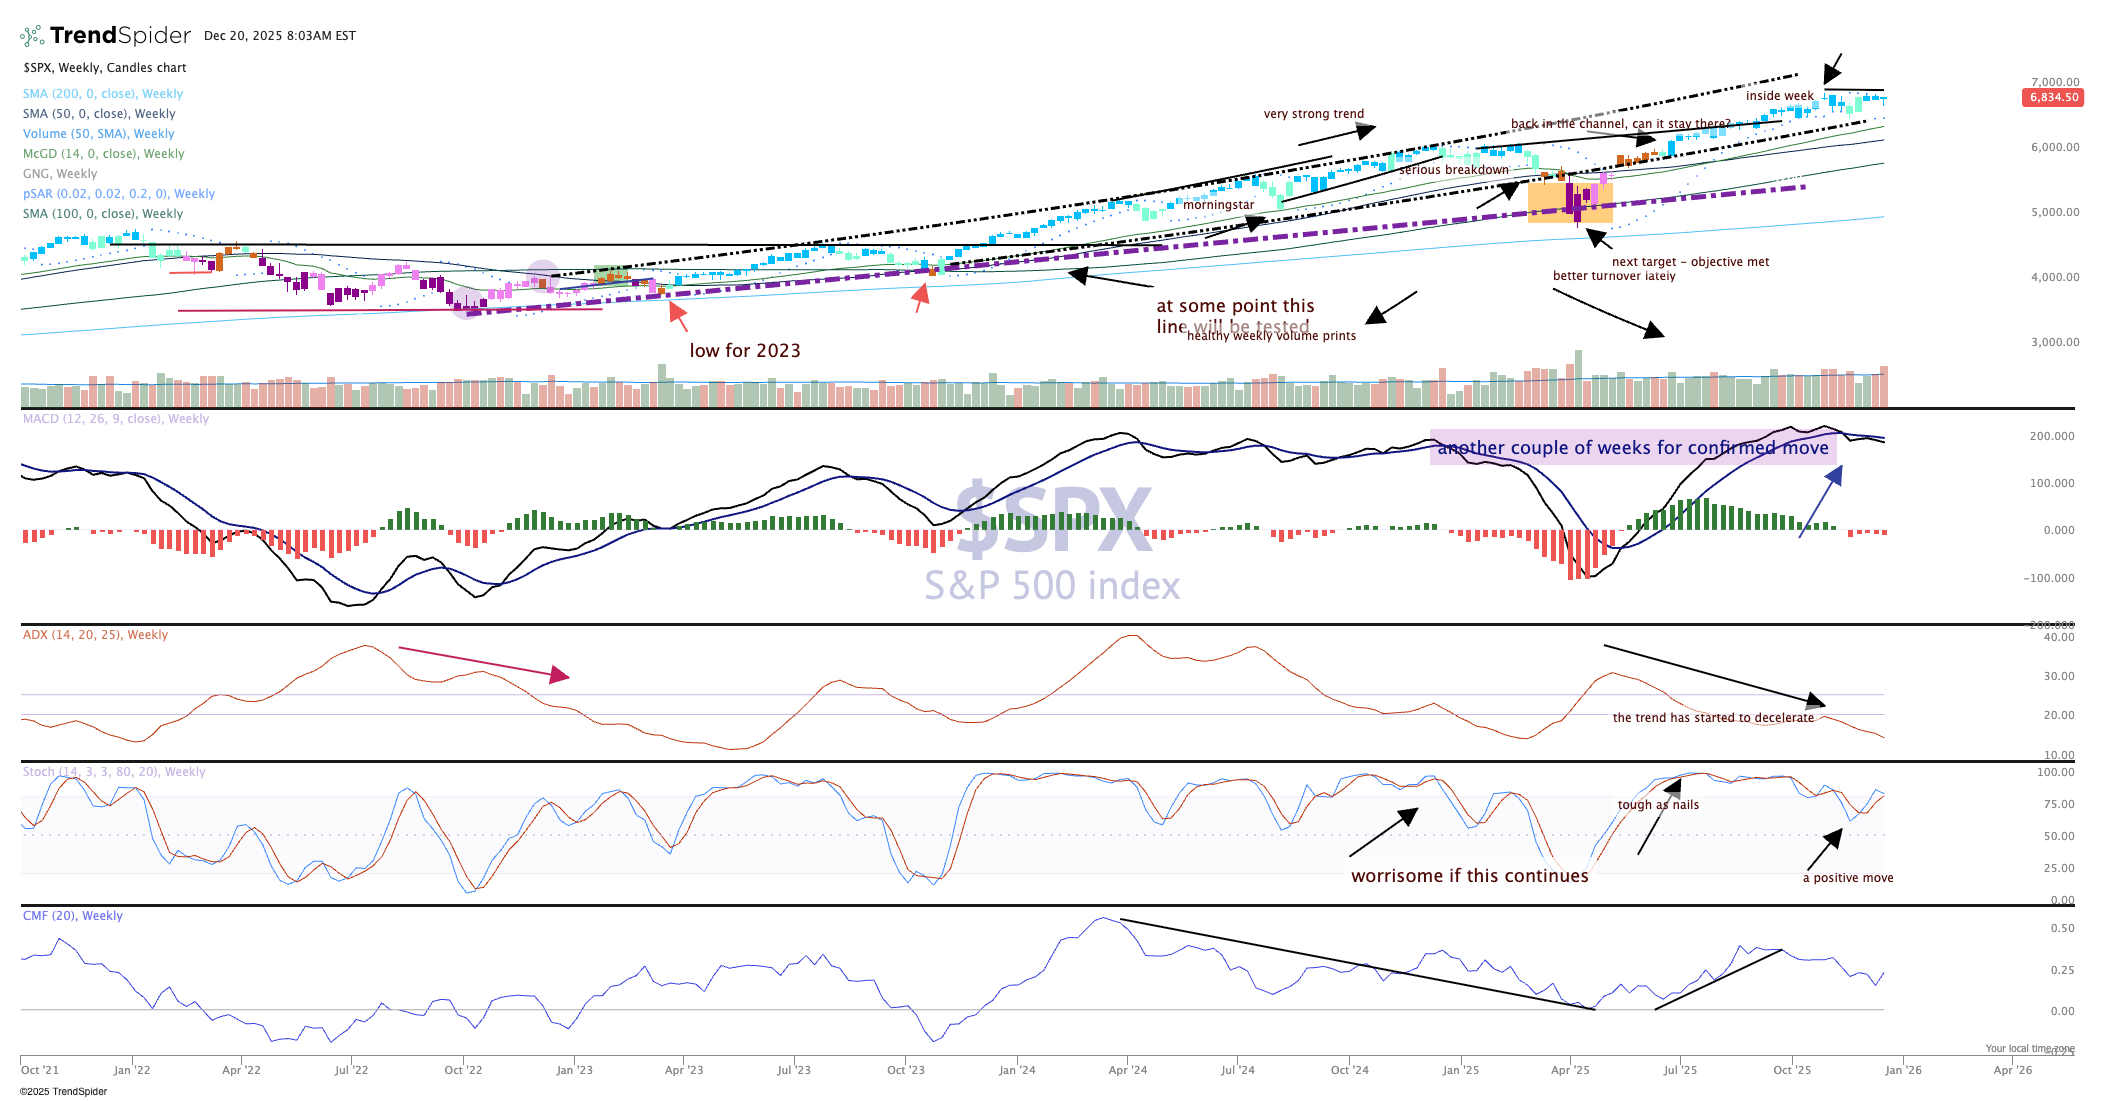
Notice on the ADX indicator (pane 3) the trend is pushing toward zero. That makes sense when we have the volatility index as low as it is (15%) — the expectation for large movements is small. Stochastics are actually moving to positive (pane 4) and the money flow remains bullish. The candles are blue still, indicating a strong bullish condition as we begin a shortened trading week.
