Charting the S&P 500: 14 Weeks of Stability as Seasonal Patterns Turn Bearish
It's tough to make significant progress with recent activity.
You've reached your free article limit
You've read 0 of 1 free Pro articles.
It has been very difficult for the S&P 500 to break out of this recent range, we'll call it 6800-7000. In fact, we can go back 14 weeks before we find this weekly chart closing below 6800. Now, I'm not sure who should receive the credit for this stability. Maybe the bulls just see a chance to buy the market on those frequent dips but are not willing to push the market higher, at least not yet.
No question the action has been quite frustrating to both bulls and bears — just the way the market likes it to be (that was sarcasm!). Eventually the market breaks in one direction or the other, although the probabilities tend to favor the direction of the prior trend. That of course would be higher. However, we see a few cracks appearing in the technicals that need to be of focus.
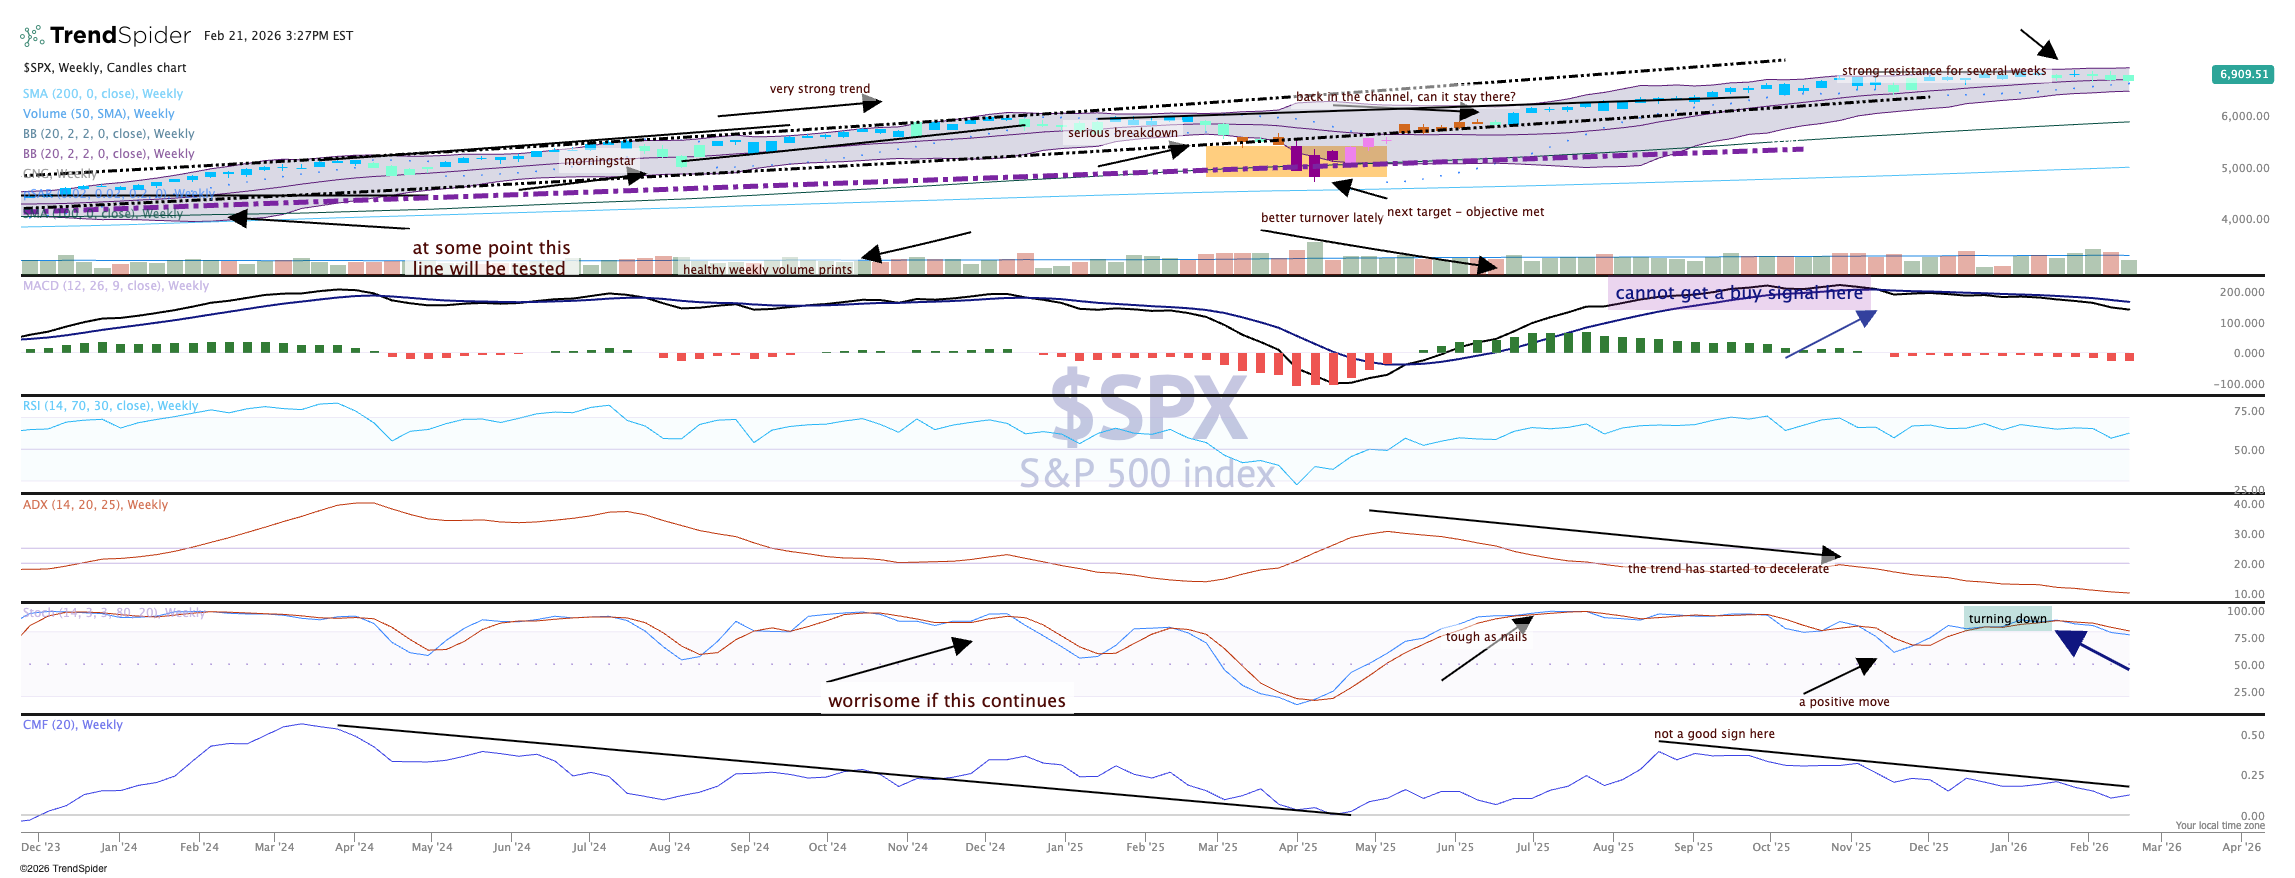
First, the chart remains bullish, with teal candles. This is a cautiously bullish stance, but we give the benefit of the doubt to the bulls.
However, the MACD (moving average convergence divergence) remains on a sell signal, and stochastics have turned down as momentum seems to have been lost, while money flow is poor but still positive. We would like to see this improving, not making lower highs and lower lows. Something to watch closely.
