Charting the Nasdaq: Divergences May Have Negative Consequences
Earnings from the biggest names in the world are approaching and a lot of questions remain to be answered.
You've reached your free article limit
You've read 0 of 1 free Pro articles.
Today we'll look at the Nasdaq 100 through the Invesco QQQ Trust (QQQ) weekly chart. Many names in this big index will report earnings over the next couple of weeks and it serves us well to focus in on this group from time to time. After all, the Magnificent Seven are always in the spotlight, and with three of those names reporting this week (Tesla (TSLA) , Meta (META) , Microsoft (MSFT) ) we'll have a good idea how much the investing public appreciates these companies.
The chart shows huge divergences. The price chart on the weekly is without a doubt bullish. Higher highs, higher lows is our textbook definition of an uptrend. However, we may have seen the highs for a while, because the strong volume of late has not pushed prices higher. That is an important divergence. Moving average convergence divergence (MACD) is on a sell signal and has been since November.
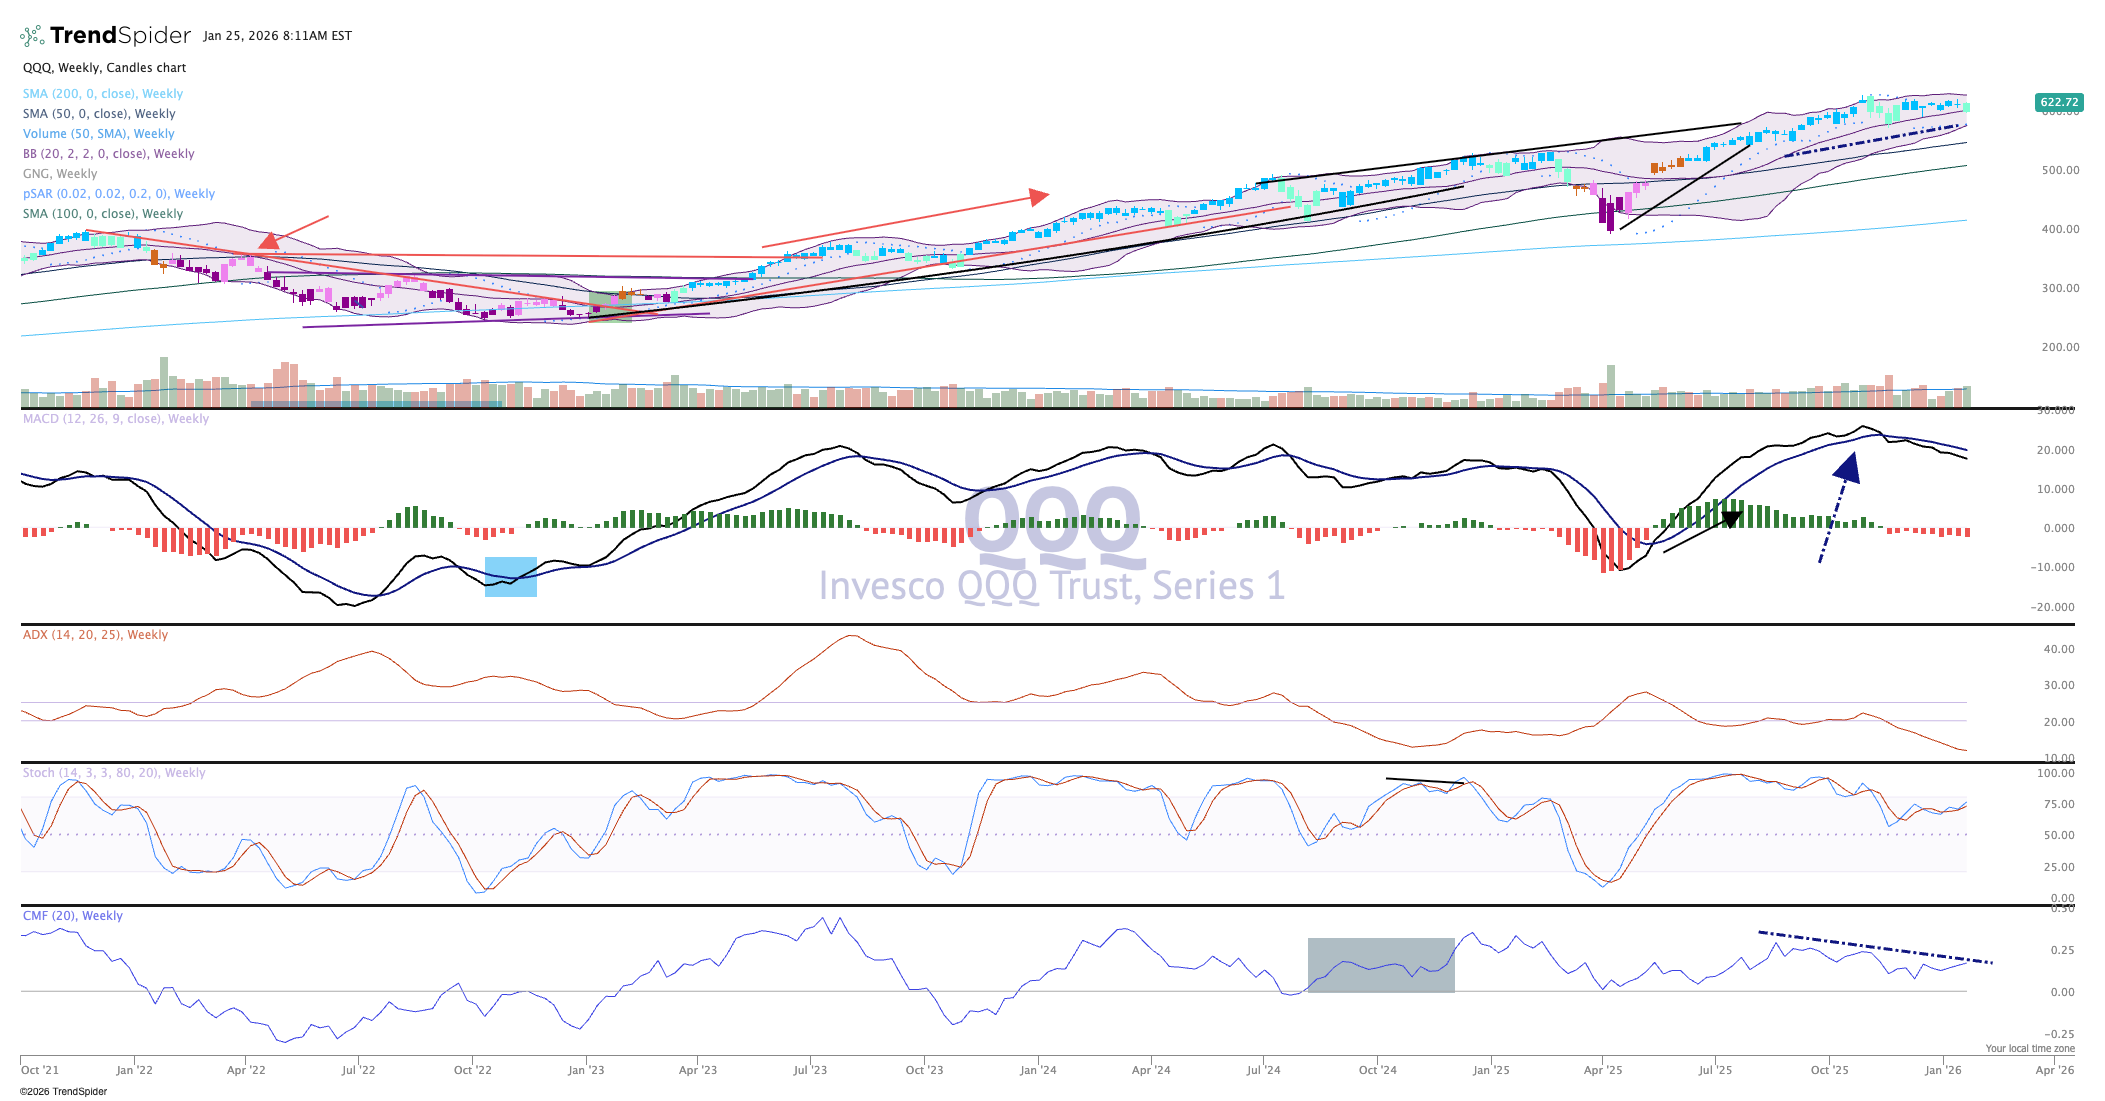
Momentum is down on the QQQ, with the ADX also showing no trend in place. That makes sense as the ETF is just going sideways. Money flow is positive, though, but not growing, but we'll reluctantly put that in the bullish camp.
This week will be interesting with the end of month, a Fed meeting and the aforementioned earnings releases. Can the Nasdaq 100 make a move to higher ground? If not, there is a long way down to next support, about 10%. We'll soon find out.
