Charting the Markets: What More Do You Need to Prove the Trend?
The higher the staircase climb, the more concern about being the last one in.
You've reached your free article limit
You've read 0 of 1 free Pro articles.
As we have frequently talked about, the markets climb a "wall of worry," and when that wall is up high the more investors/traders fail to scale those heights. The market has been strong for a while now but the bears have simply been rejected each week.
If you notice in the chart of the S&P 500 below, the candles have been making higher highs and higher lows since breaking out of the orange box (top pane), which is the textbook definition of an uptrend. What else do you need for the markets to prove the trend? Are you able to perfectly time your entry point at the exact right moment?
Of course not, trying to time market bottoms and tops is a fool's game. We simply observe what is happening in the moment, identify supporting indicators that give us clues to whether a trend can continue.
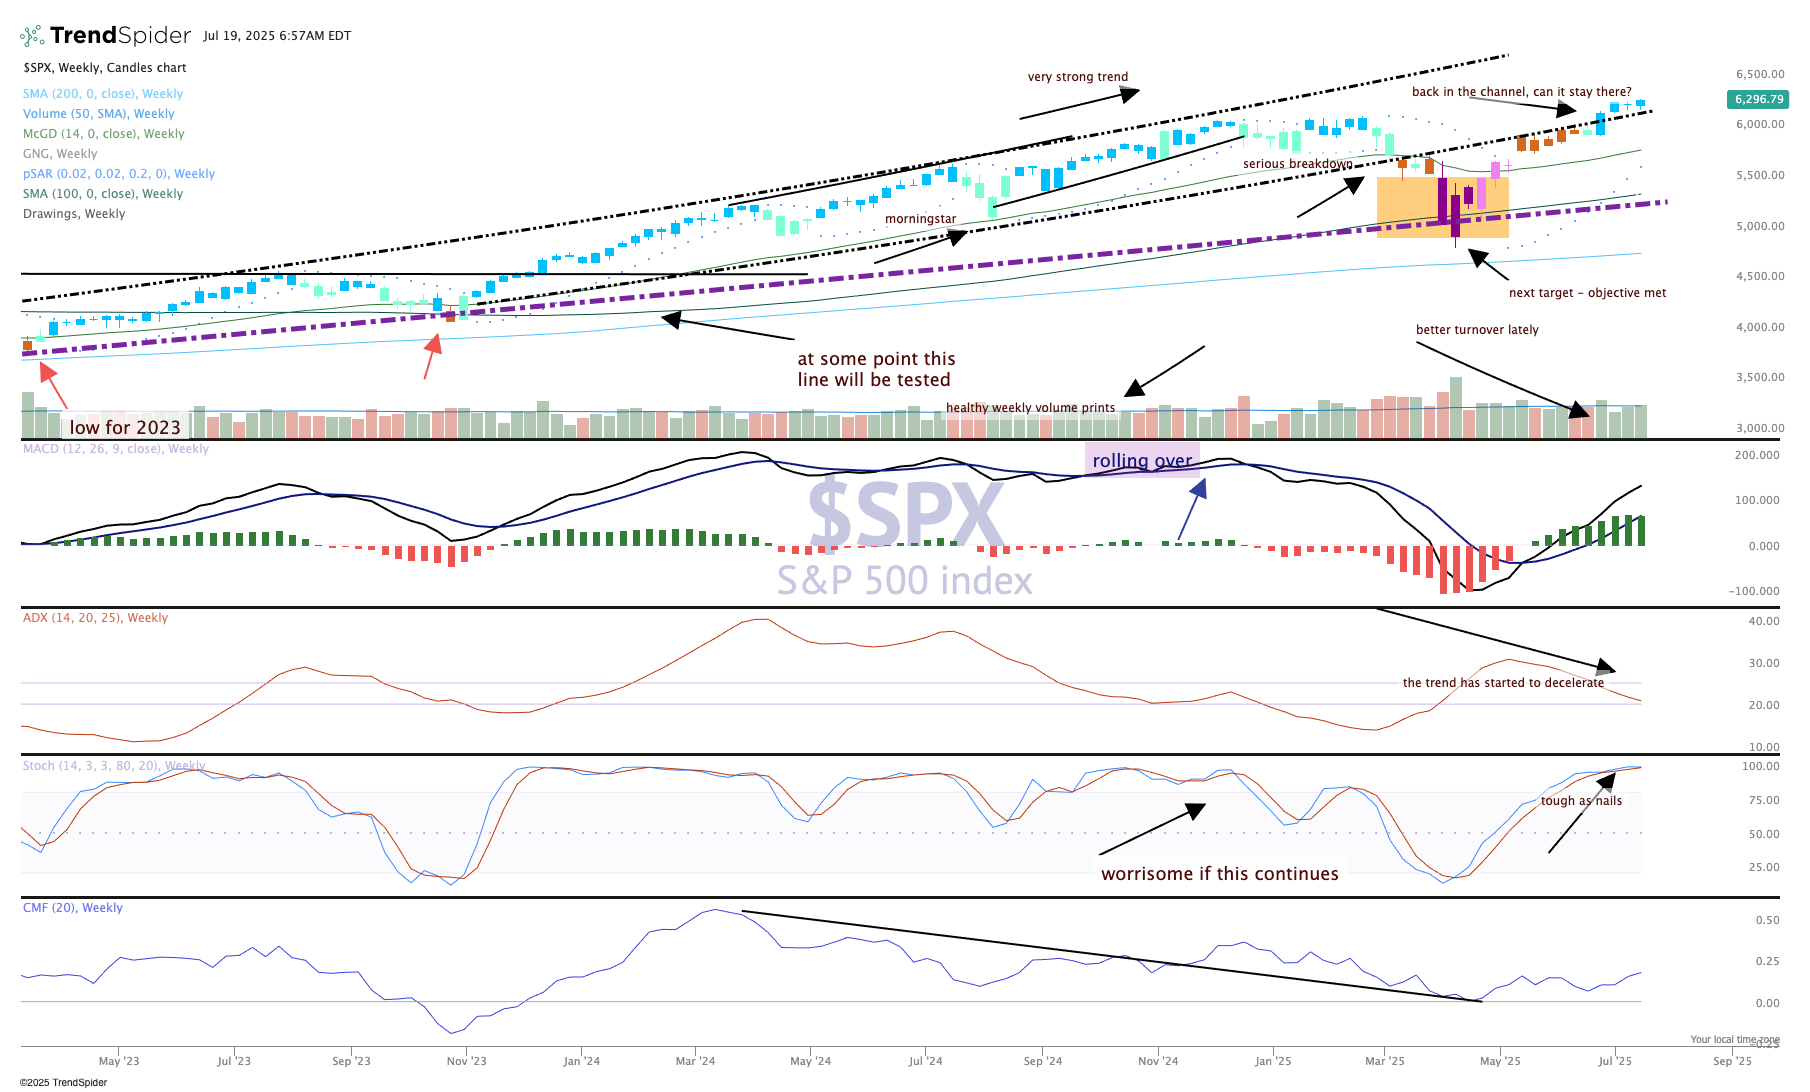
What we see is this: Money flow is bullish, the MACD (moving average convergence/divergence) is still on a buy signal, stochastics (momentum) is very strong and the directional trend has slowed down significantly. The candles are blue, which means a strong buy on the GoNoGo composite of indicators. Lastly, the price chart is back in the uptrend channel.
I ask again, what more do you need? Bullish until it is no longer!
