Charting the Markets: The S&P 500 Continues to Move the Goal Posts
The intermediate trend is in place, but there's one impressive indicator.
You've reached your free article limit
You've read 0 of 1 free Pro articles.
There was some good action in the middle of last week surrounded by sloppy play from traders, but the index still advanced and closed at an all-time high. With really only one strong session this past week that was truly impressive.
Other indicators were weak, especially breadth and volume where we saw some extremely erratic price movements. That happens when volume is poor and liquidity is dry. There was one day, though, that managed to rise above those impediments (Tuesday) but all other days were mostly consolidation.
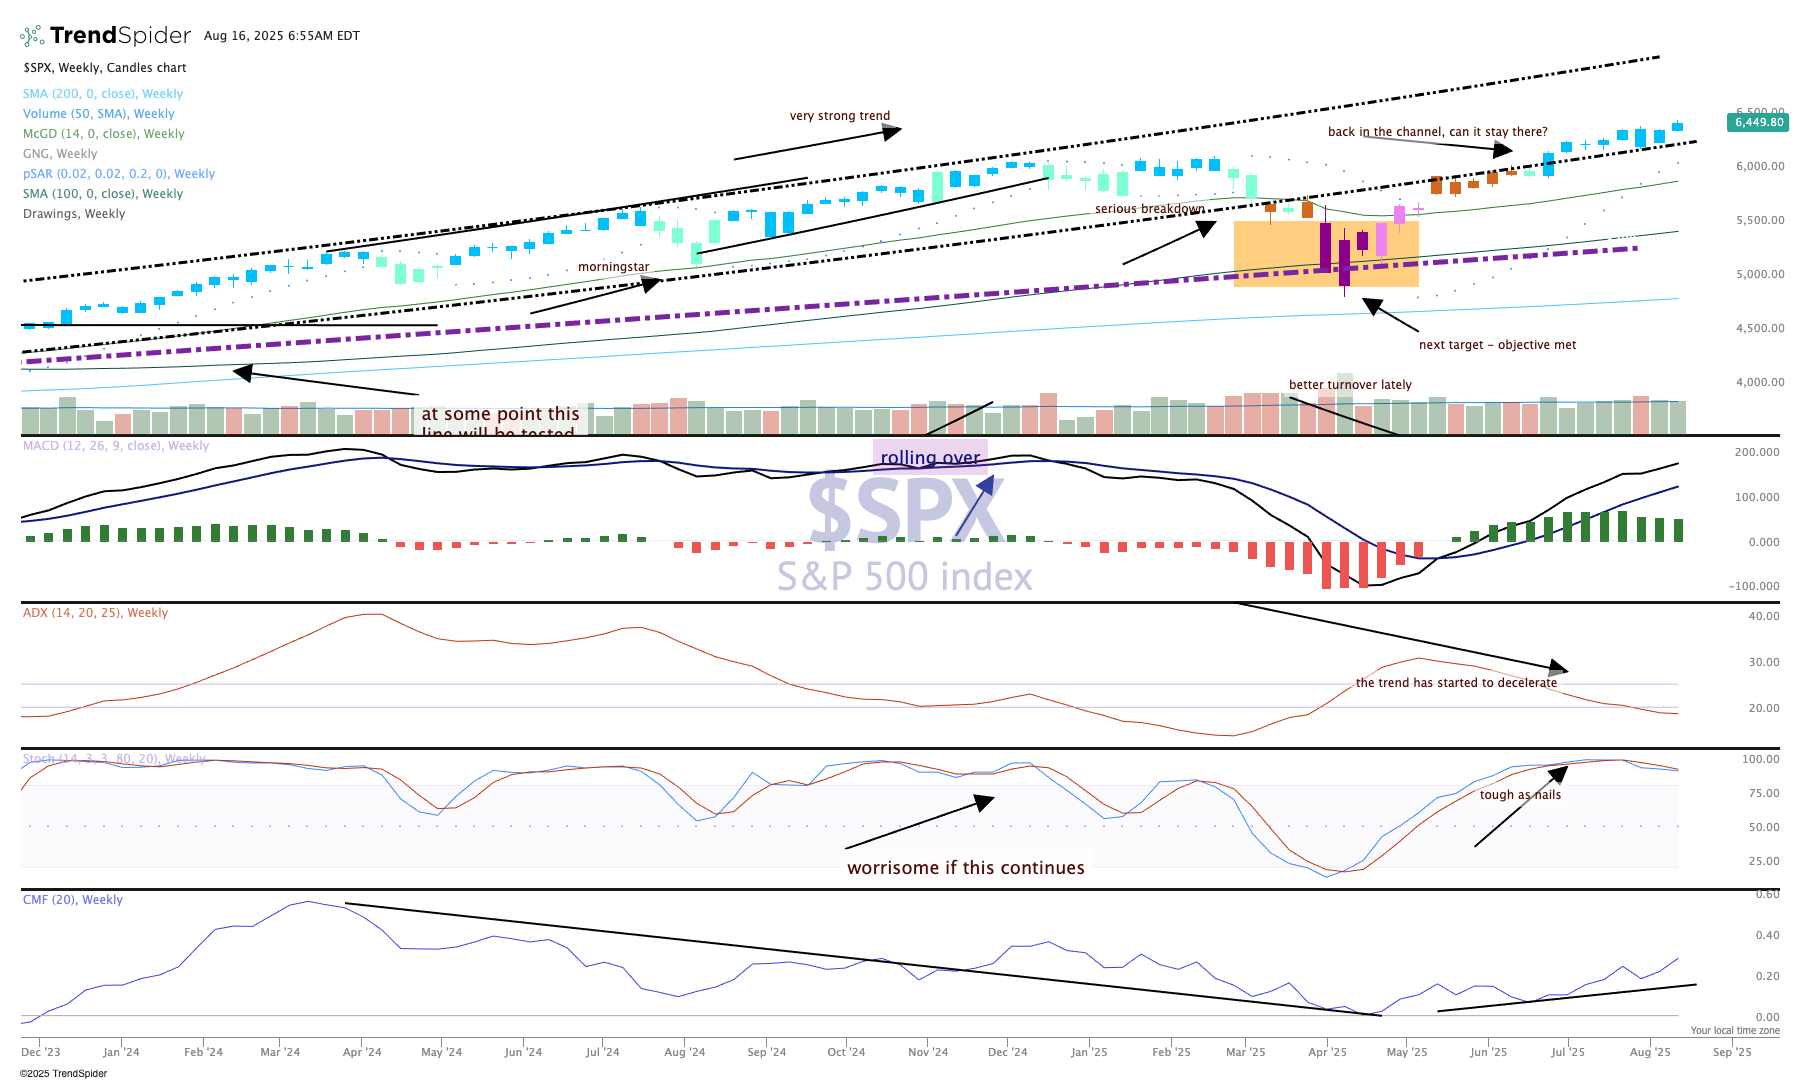
The indicators are in pretty good shape here. The weekly price chart shows a higher high, higher low last week as the GoNoGo indicator remains blue (strong bullish). The third pane shows the ADX, where the trend has declined significantly. In fact, there really is not a strong trend to consider here, which could change quickly as news items are announced (tariffs, Fed, etc).
One impressive indicator is at the bottom, the Chaikin money flow. Higher highs and higher lows tell us money is at least flowing here, if not at a rapid pace. That is bullish.
