Charting the Markets: Tech Stocks Lead the Way as Big Earnings Loom
Stocks continue to trend upward with fresh new all-time highs printed this past week.
You've reached your free article limit
You've read 0 of 1 free Pro articles.
With markets ending the past week at new highs once again (Nasdaq, Russell 2000 and S&P 500) there is little doubt what the current trend is. But for some reason there is quite a bit of doubt, until the markets swing upward with a giant gust of wind. We call that the "Wall of Worry," where most on the sidelines doubt the markets will continue higher whether it is overbought or not.
Remember, overbought is simply a condition and not a signal, hence most traders/investors time it wrong. The best process is to find the trend that is in place, using technical tools, and have faith and belief it will continue.
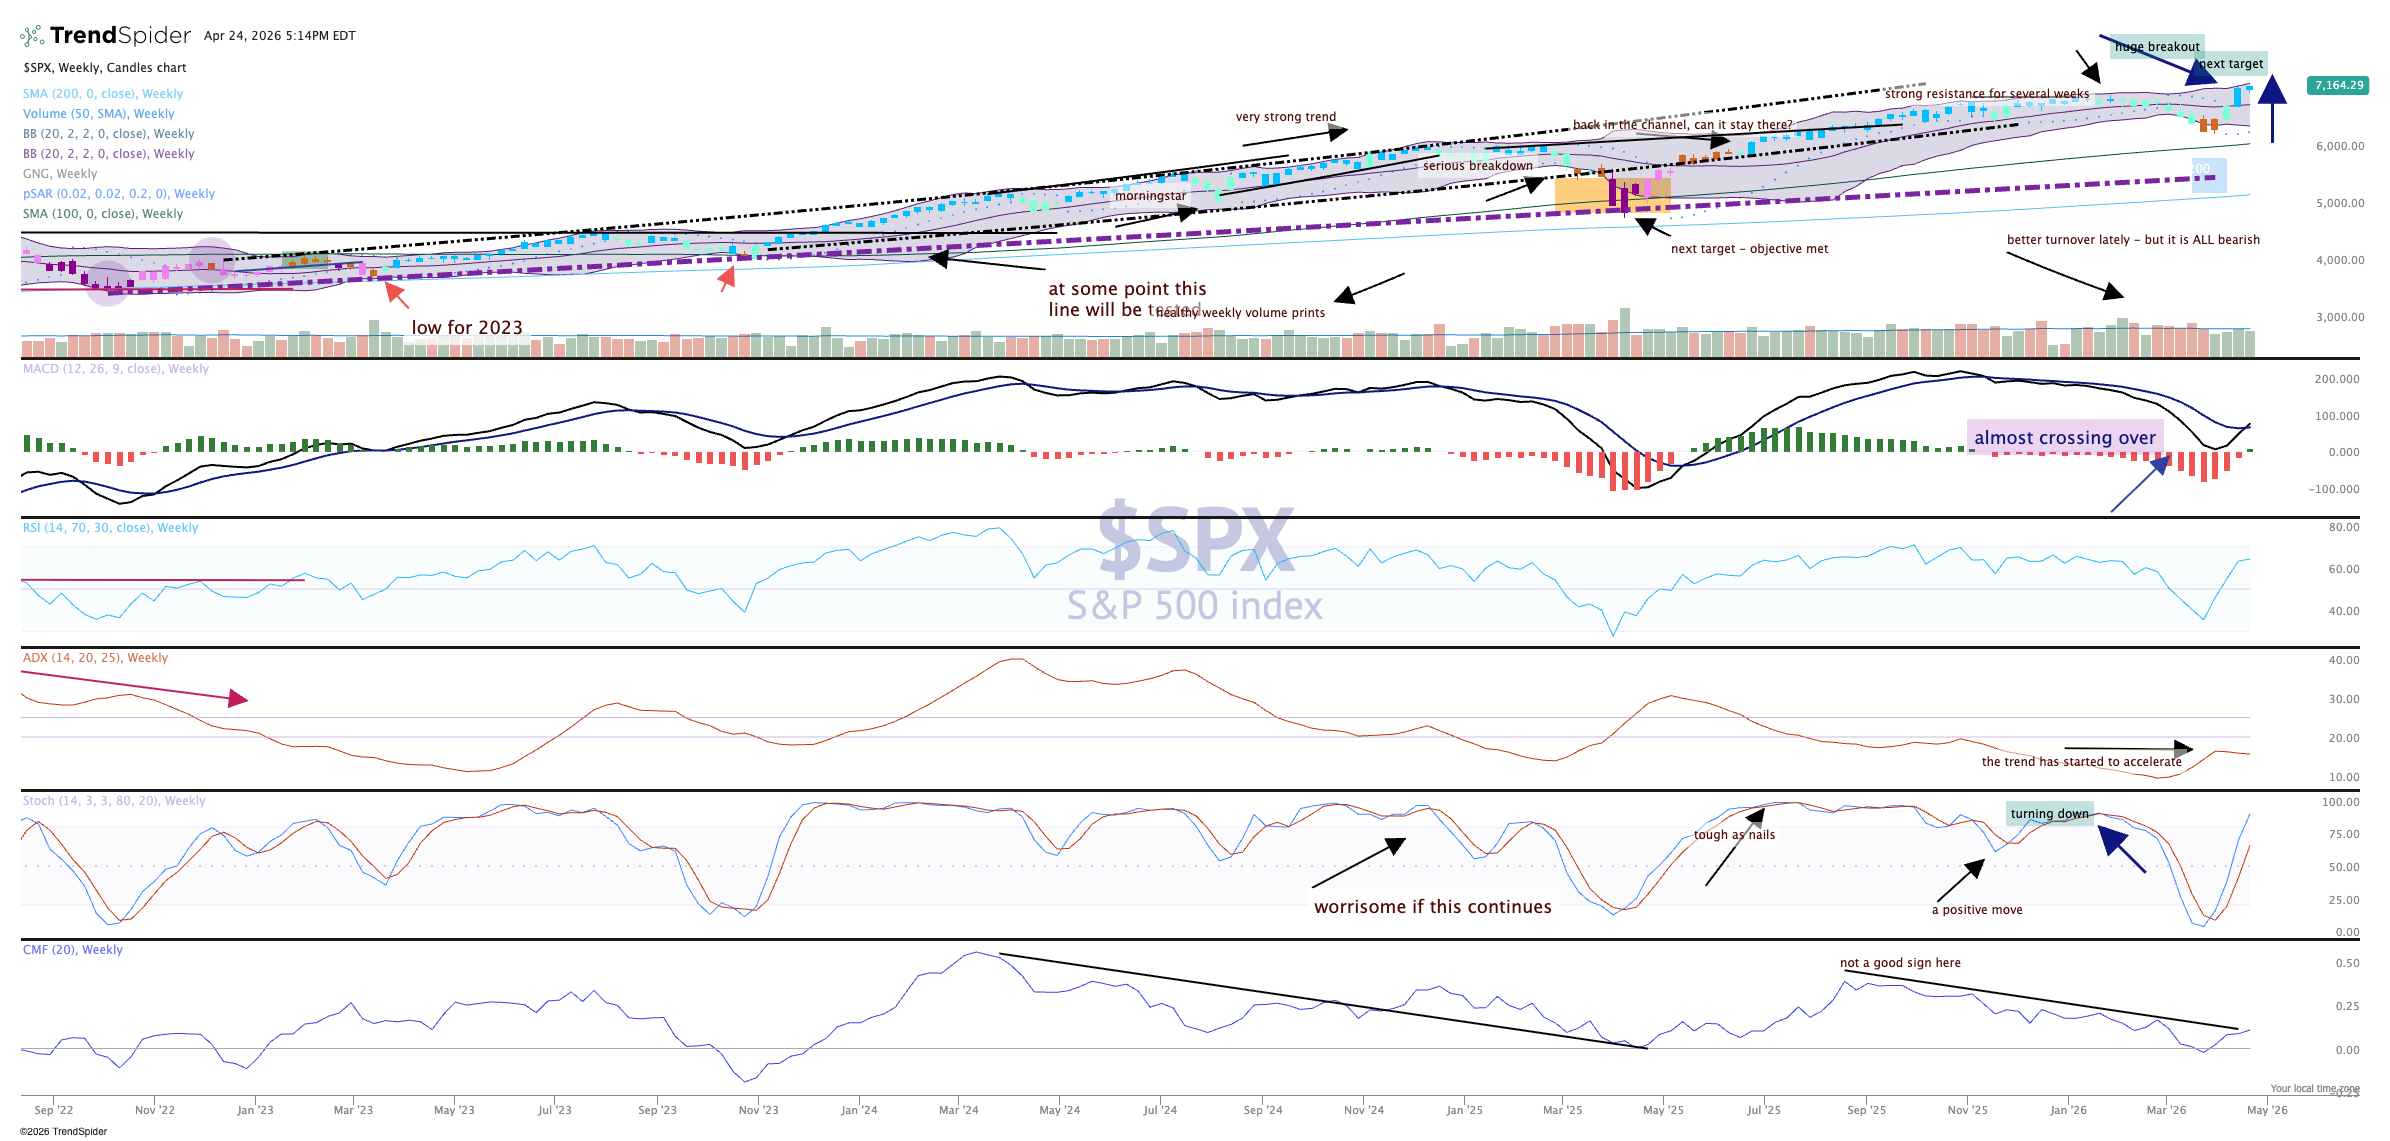
Of course, the price chart of the S&P 500 confirmed the bullish structure this past week, with a second blue candle. That stands for bullish on the GoNoGo composite of indicators. The MACD (moving average convergence divergence) has confirmed for an important buy signal, the first one since a cross under back in September. Recall the last bullish crossover was in May of last year, which led a bullish charge for months.
Money flow continues to improve, stochastics are rising but are not overbought yet. The occasional scary day like Thursday April 23 is still out there, but with big earnings coming up unless the market sells the news there should be more good price action to come.
Related: Bearish Bets: Three Tech Names Tumble on Earnings
