Charting the Markets: S&P 500 Pulls Back to Critical Level
The lower end of a tight trading channel is what needs to hold at this critical time.
You've reached your free article limit
You've read 0 of 1 free Pro articles.
Well, so far, January is following the same script as December.
Even if it was a short trading week, much like the prior two weeks, there was plenty of volatility, worry and higher rates to go around. The bond market continues to show worry and concern over higher prices (inflation), and the stock market has come around to the notion that inflation is not good for the economy. Remember, the stock market is a very accurate predictor of future economic activity, though it is not the only thing we rely upon.
The shaky action this month and leading into 2025 is indicative of a large swath of nervous investors. That makes sense, especially as it appears the Federal Reserve may pass on executing more rate cuts in the near future. In fact, the futures market sees little to no rate cuts in 2025. The stock market is adjusting to this "new" normal environment, kicking and screaming.
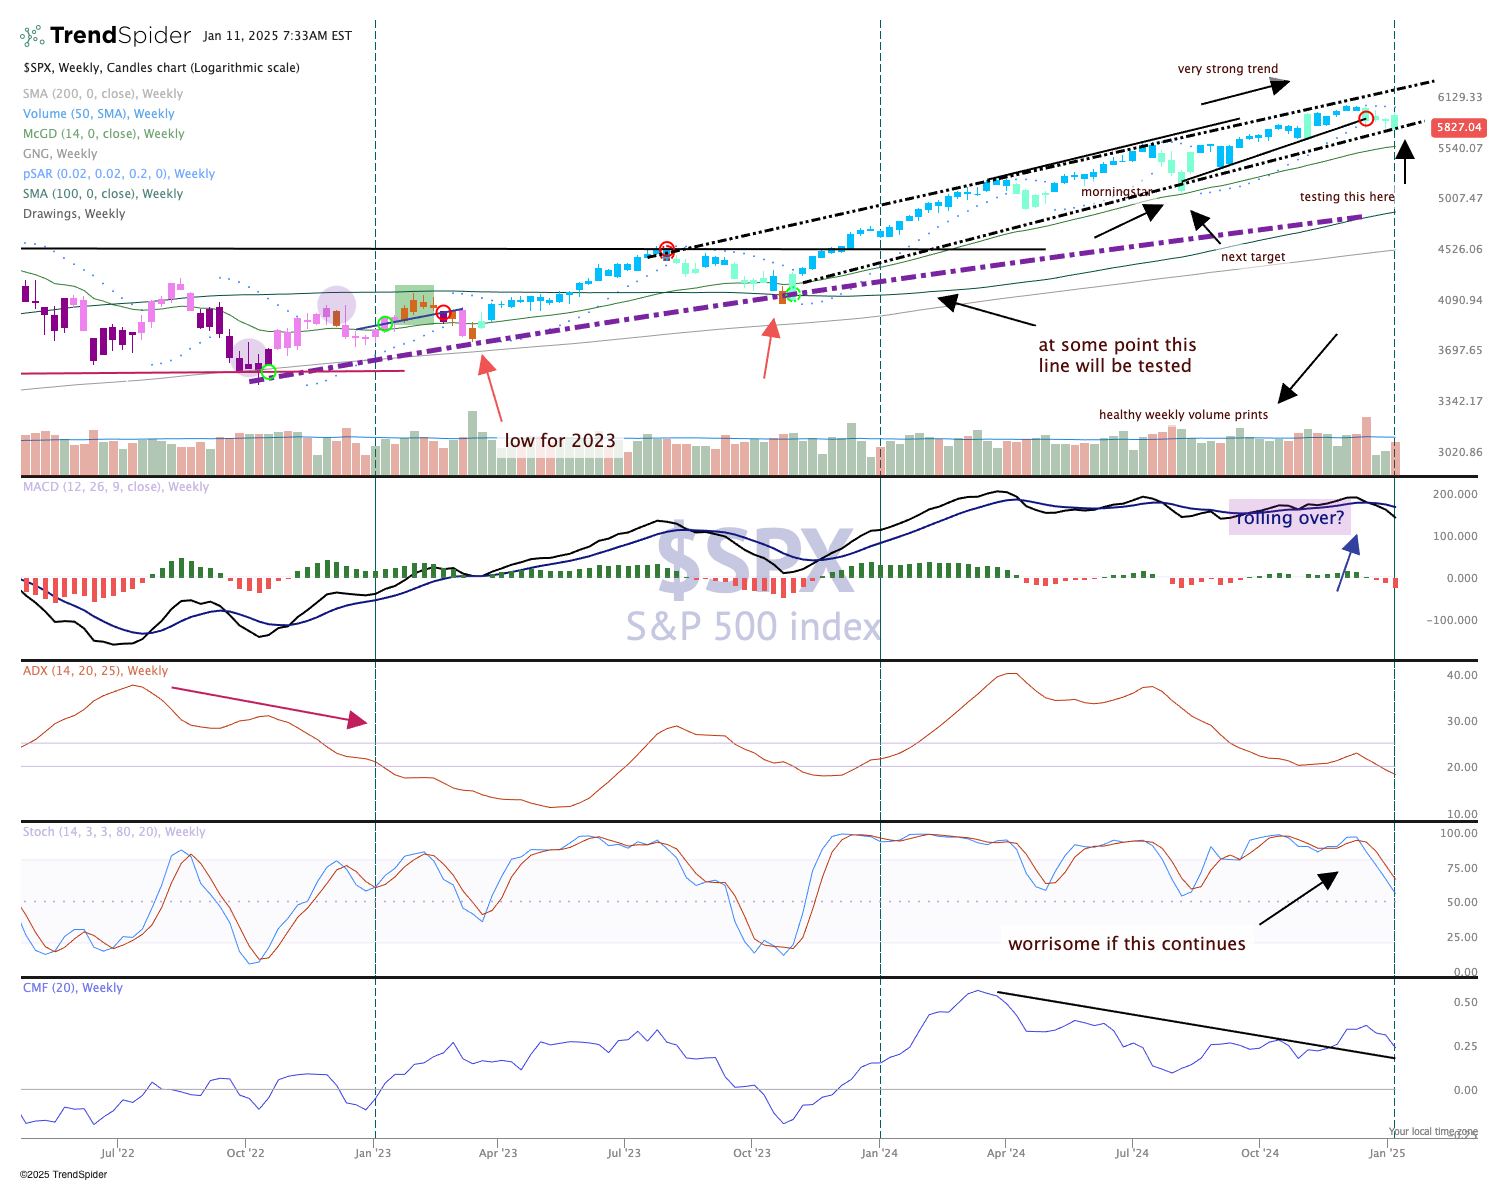
The chart of the S&P 500 is at a critical juncture. While the candles are teal (cautiously bullish) on the GoNoGo composite of indicators, the secondary indicators like the MACD and Stochastics (panes two and four) are bearish. Money flow continues to move out, that is evident by heavy volume days when the market is down. This past week had three such days (distribution).
While it may be tempting to continue with the downward movement we need to wait to see if the channel drawn is broken and confirmed. That would take two closes. As an aside, an gap was left open on the daily chart at 5,783 which is the next area of interest, and obviously would be below the channel. But if that fills and buyers step in, that could start a bullish move, just in time for earnings season.
