Charting the Markets: S&P 500 Trying to Join the 'Cool Kids'
New highs for the industrials and small-caps have the other indexes chasing.
You've reached your free article limit
You've read 0 of 1 free Pro articles.
What might be considered a poor week was really just a very tight range that kept the S&P 500 right near the all-time highs.
It sure looked as if the index was ready to make a run to 6920 after a first time closing above 6900 on Thursday. But it was not to be. Instead the bears shook the bulls out from the trees and tried to deliver a nasty blow. However, as we see from the chart below, it was simply a "face slap." Though it seemed rough all day, the index just received a scratch.
Still, let's not fool ourselves here. The action on Friday and earlier last week was volatile. The VIX did close well under 15% on Thursday, and that was enough to send shockwaves to the bulls. A red alert went up fast, which started the selling and did not let up to the final bell.
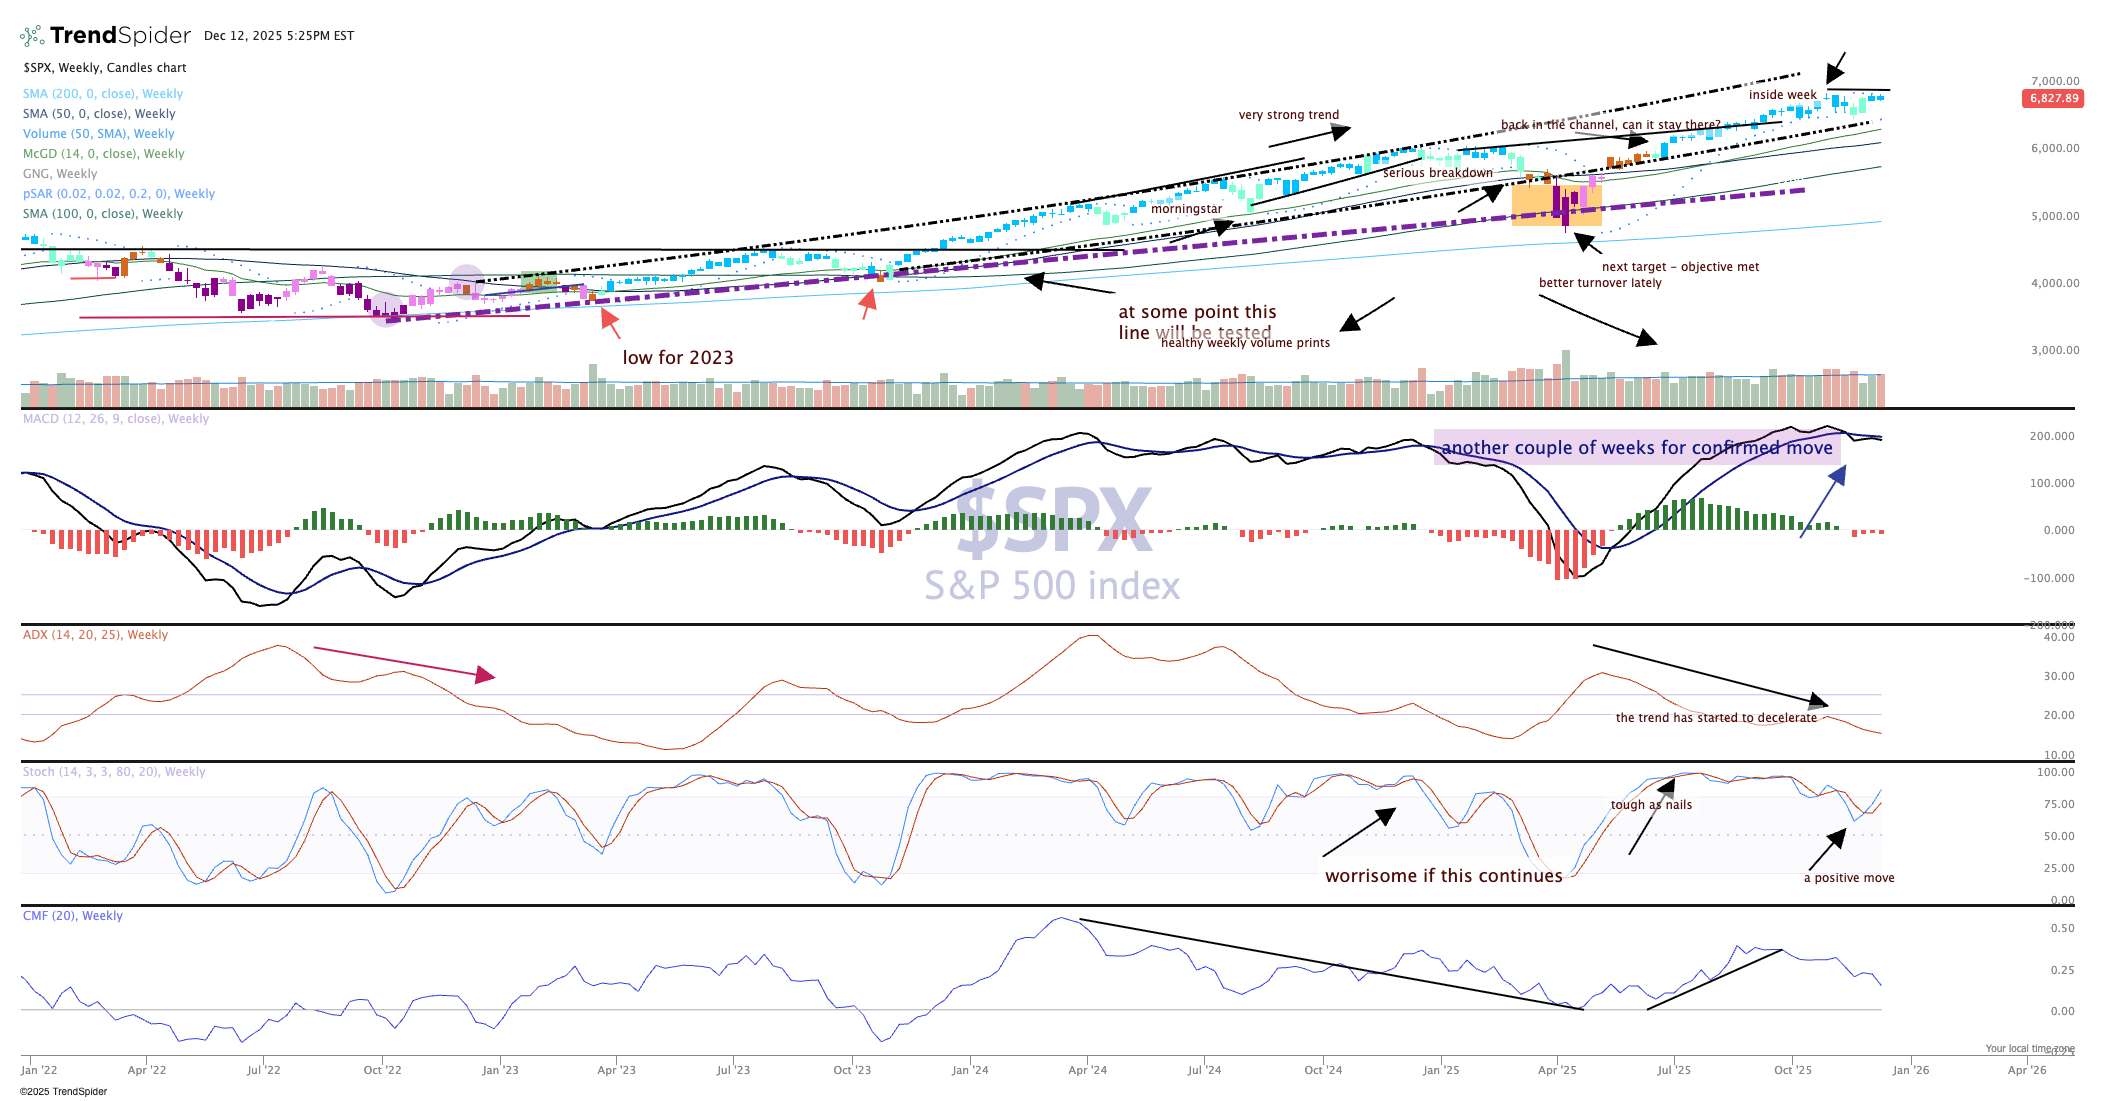
Stochastics still seem to be in a good place, but the moving average convergence divergence (MACD) is now confirmed on a sell signal. Money flow is negative as the trend continues to decelerate (ADX, pane 3).
The S&P 500 can only withstand a couple more weeks of sideways movement until the moving average comes to meet the price, and a decision point will be at hand.
