Charting the Markets: S&P 500 Looks to Be Running Out of Steam
Despite some strong volume, this market might be vulnerable to shaky-handed sellers.
You've reached your free article limit
You've read 0 of 1 free Pro articles.
Our weekly chart of the S&P 500 remains bullish, the candles are blue, but if you squint hard you can see the last candle was hardly impressive.
Sure, the market was up for the week and momentum rose up for a second straight week (stochastics in pane four). But other indicators seem to portray the 500 as running out of steam. Notice even as the chart is bullish the MACD remains on a sell signal. With a lower high and lower low in the chart the trend may be shifting to bearish though we may need to see a few more candles before that is confirmed.
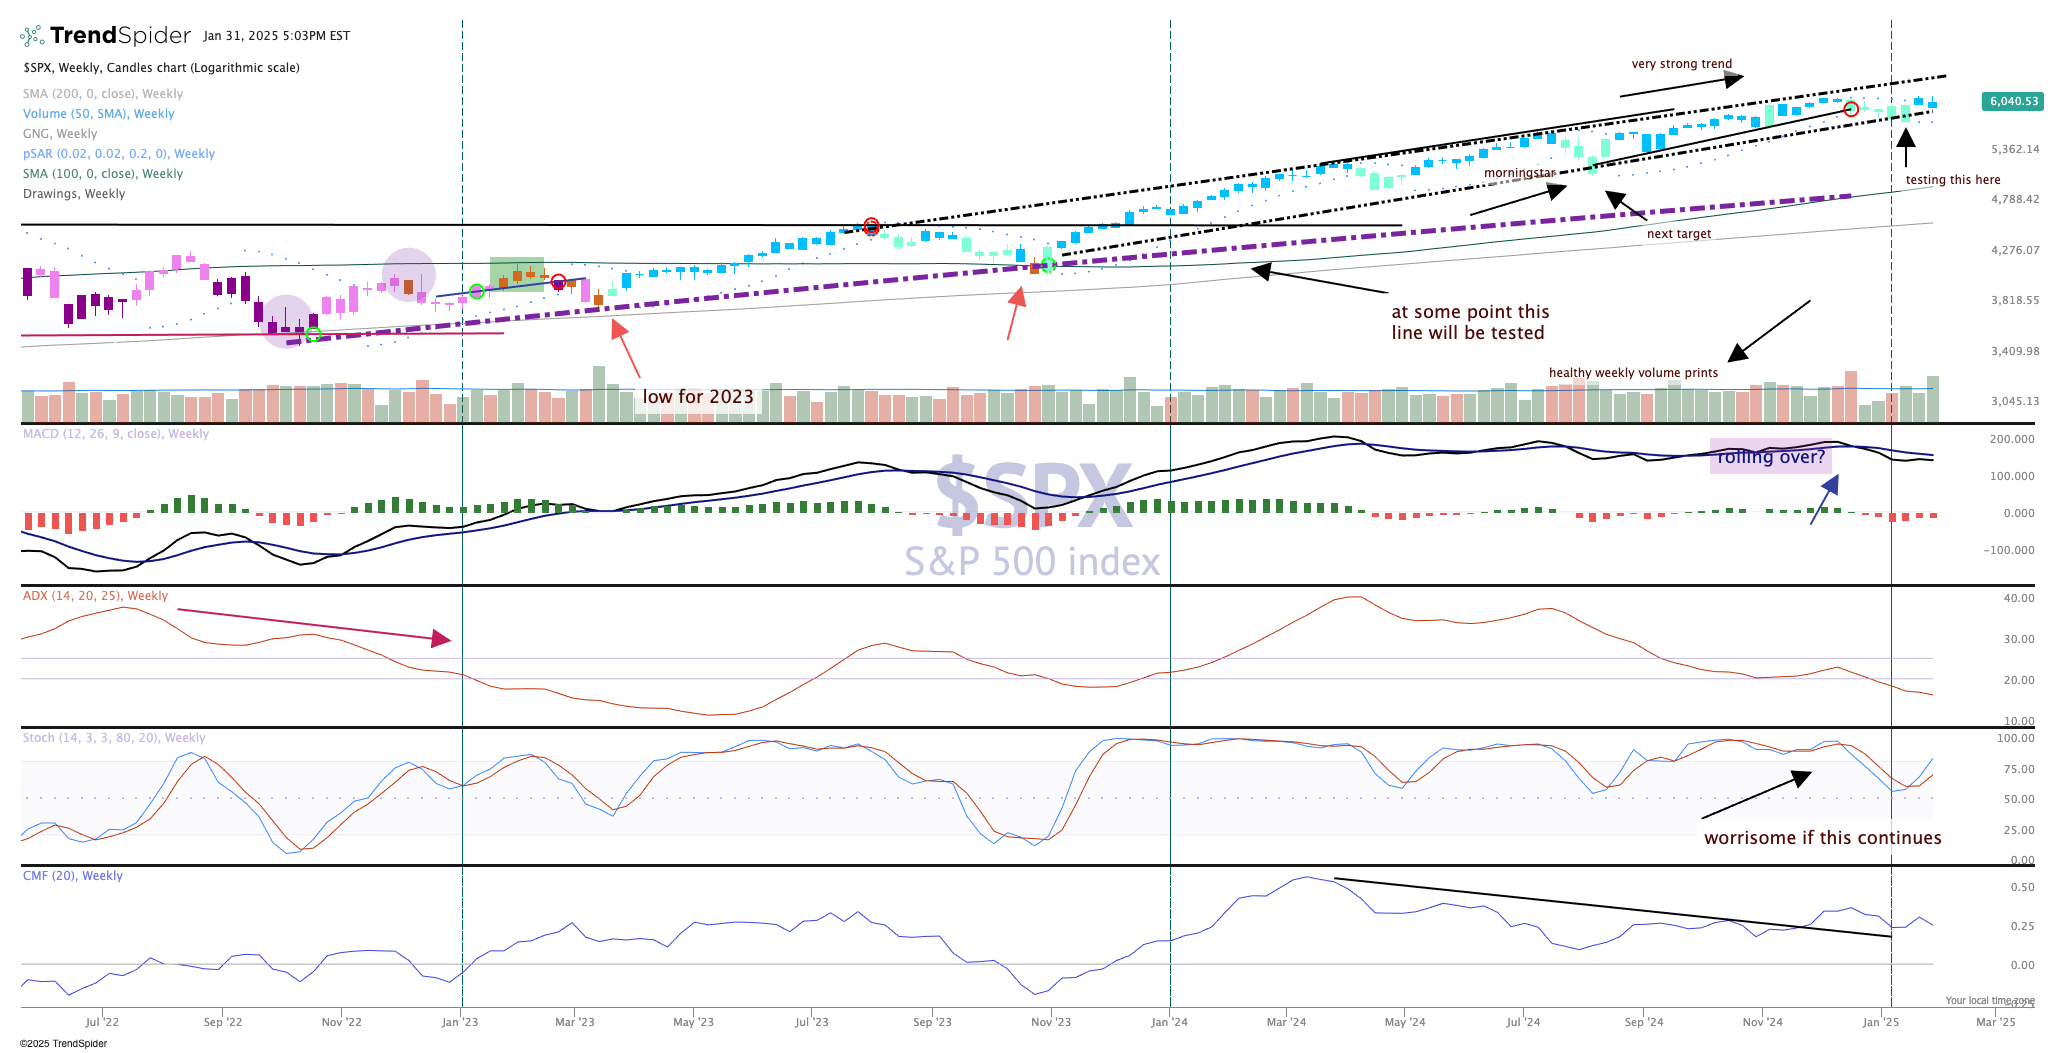
To be sure, the action in January was bullish and we probably should not be all that critical. Yet, momentum is weaker and money flow (bottom pane) continues to bleed out. Though we did have some good volume sessions this week, the weakness in money flow tells us the big money institutions are not heavy participants in each market rally. That leaves big moves like Thursday vulnerable to shaky-handed sellers.
This coming week is big for the markets as the Industrials and S&P 500 are right near all-time highs. If they do fall this week another leg up could be in store, but if not there are some downside targets yet to be tested.
