Charting the Markets: S&P 500 Is Right at the Top of a Wide Range
The index is having a hard time closing above this level — with the Fed meeting on tap this week.
You've reached your free article limit
You've read 0 of 1 free Pro articles.
Getting back to bullish trends was important for the S&P 500 index this past week. Notice the change in candle color from teal to blue, meaning the market is now in a strong bullish trend based on the GoNoGo composite of indicators. However, the move seems to be stalling out here, as the ADX (pane 3) has clearly decelerated and is not trending at all.
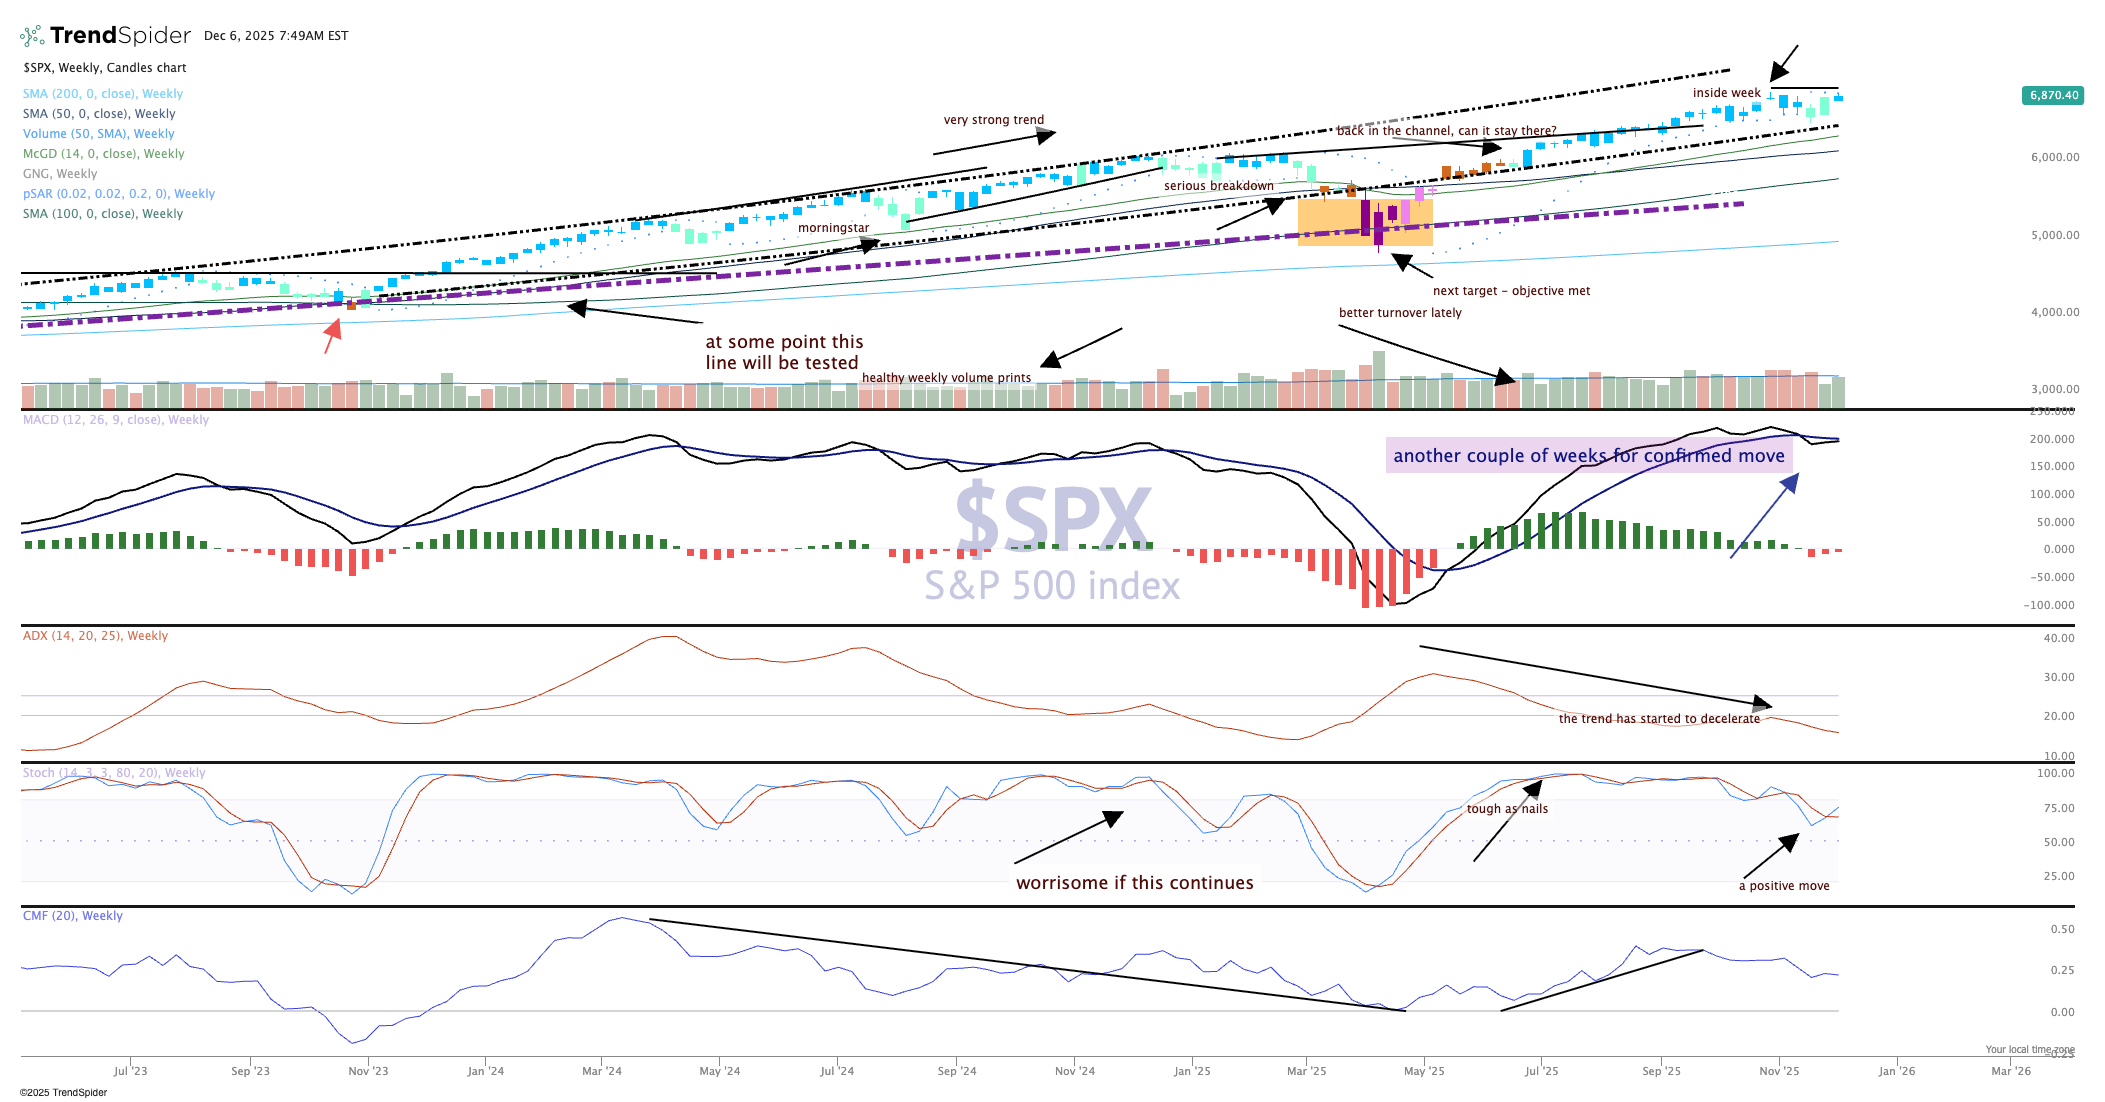
This tells us buyers are not encouraged at this high level, the top of a 6500-6900 range. Does that mean the S&P starts moving lower? It's quite possible, especially since some froth has been building in front of this week's critical Fed meeting. There is no room for disappointment or error on Wednesday, with investor expectations high.
Moving average convergence divergence (MACD) and stochastics are looking better than a couple weeks ago, and that is encouraging. Bullish seasonal patterns are still in place for a couple more weeks, so we'll see how things go to the end of the year and if Santa will bring presents or coal for traders.
