Charting the Markets: New Highs Cannot Be Anything but Bullish
Not only the S&P 500, but small-caps and the Nasdaq as well.
You've reached your free article limit
You've read 0 of 1 free Pro articles.
All it took was a little positive news to get the bulls back in the game. The doubt and worry were there a week ago, especially on that Sunday evening when it appeared that the markets were ready to take a leg down. But something funny happened on the way to "downtown," the bullish dip buyers were back with a vengeance.
Action on Monday, April 13 was very important. A massive reversal on good volume was enough to lift the indexes above some congestion. This move was critical in seeing the markets move higher, and the follow-through days later cemented the trend reversal.
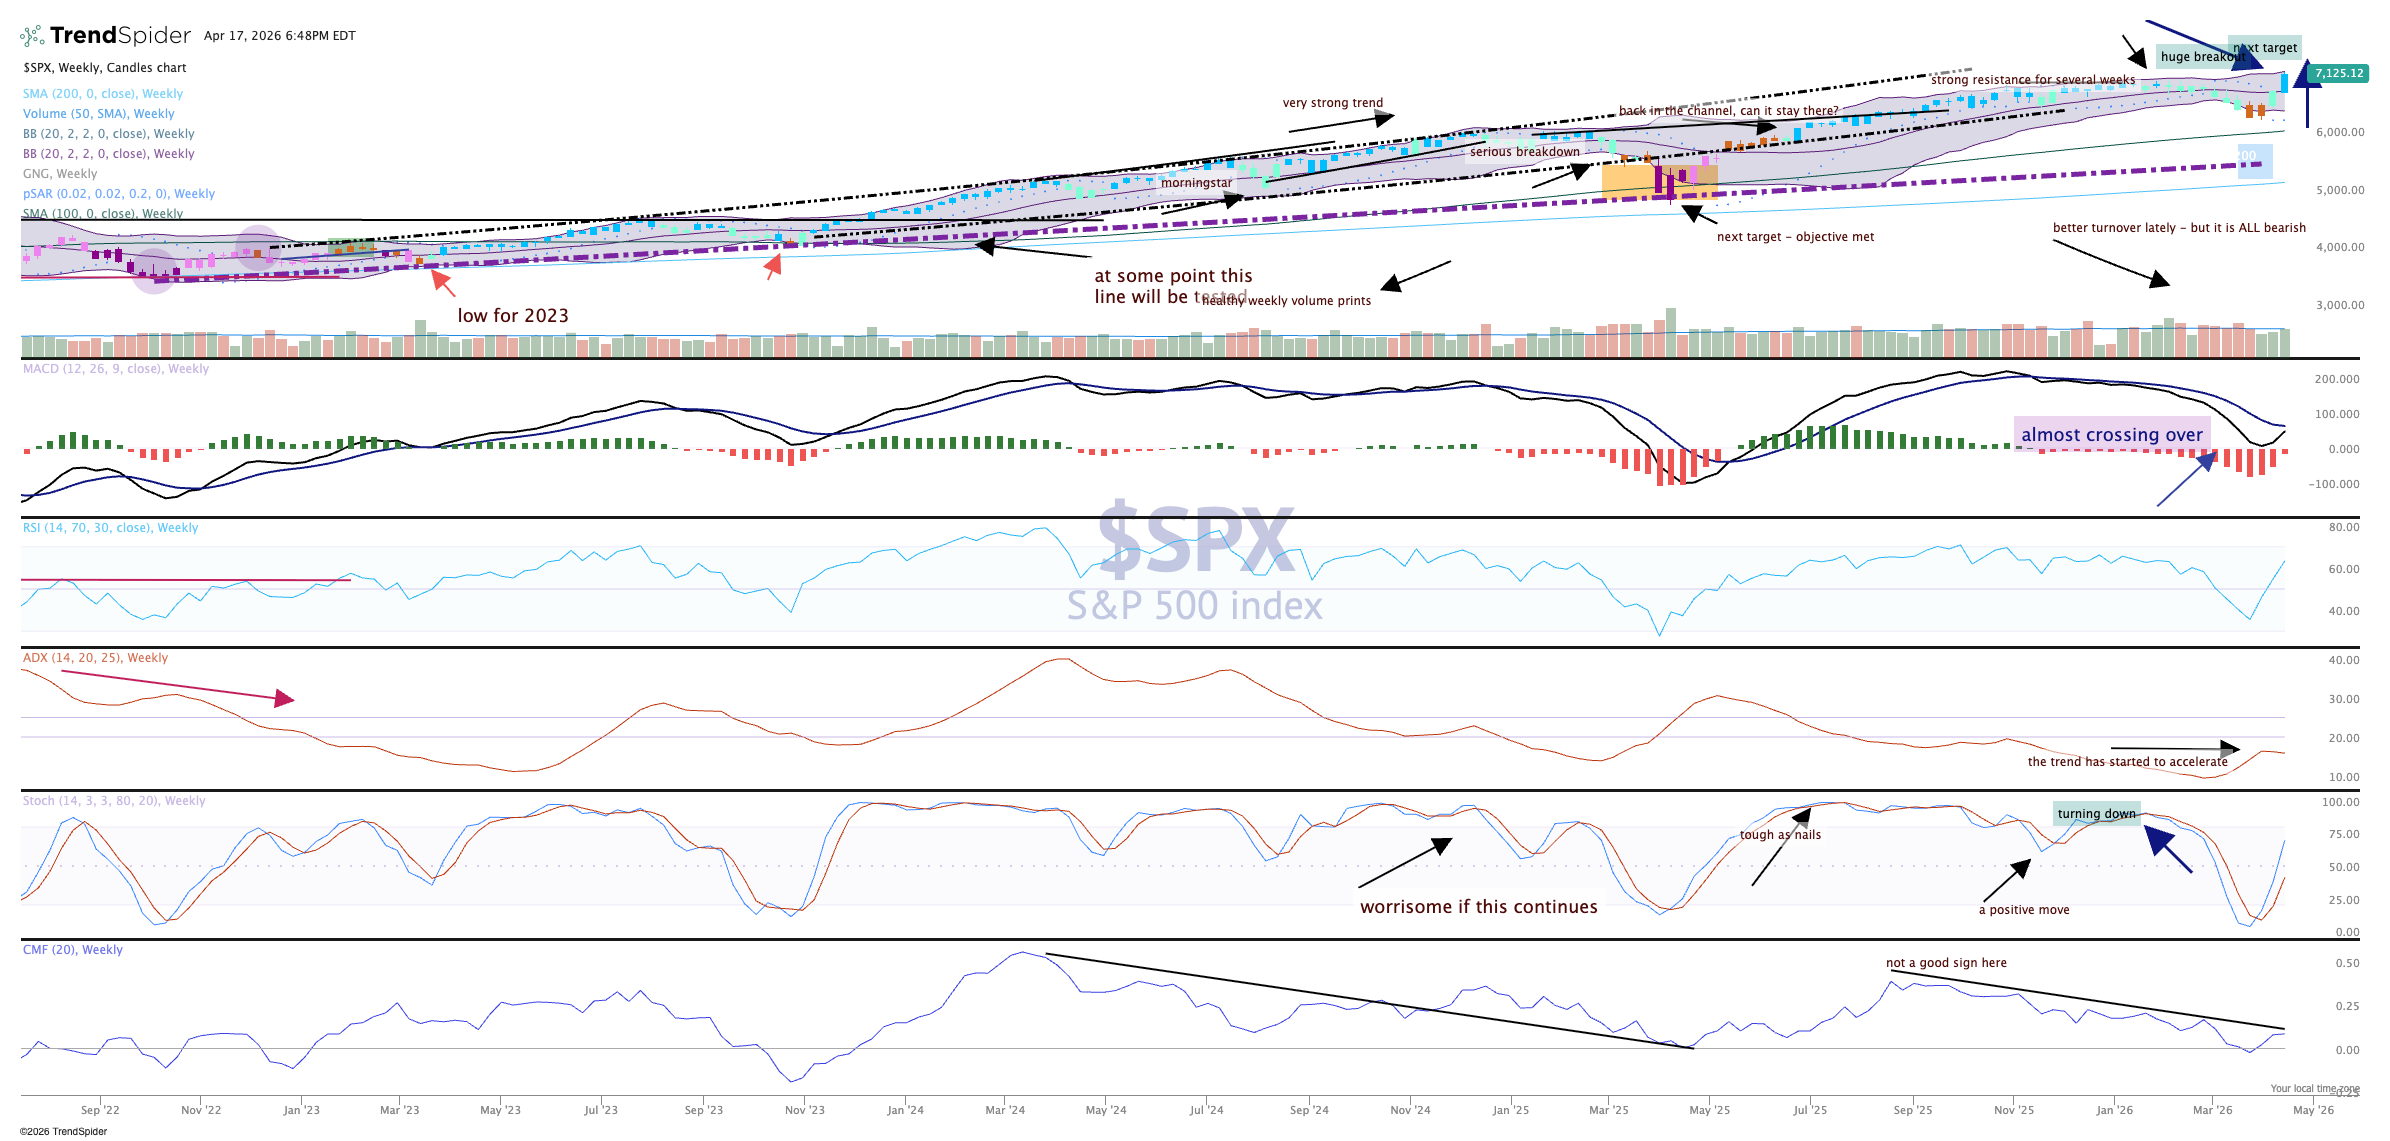
Higher highs and higher lows on the S&P 500 chart, above, makes the uptrend undeniable. The candles are back to blue, which is strong bullish on the GoNoGo composite of indicators.
MACD is in an interesting spot; momentum is strong as this indicator can be lifted to a buy signal within two weeks. Lastly, volume has improved over the last three weeks along with breadth (not shown).
While the market is overbought, there could be some severe pullbacks to scare the crowd, but we are in earnings season so that warning may be delayed a bit.
Related: Why the Smartest People Are Often the Worst Investors
