Chart of the Week: Taking a Longer View of Meta
As long-term investors, sometimes a weekly chart can provide better information than a daily.
You've reached your free article limit
You've read 0 of 1 free Pro articles.
In this chart column we usually view a daily version of the price action to help guide us in looking for trends, momentum, volume and money flows. But sometimes the daily chart can be a bit noisy, which makes it difficult to find the signals that could prompt us to do some buying (or selling).
When we fan out to the weekly chart there is some good information that can give us a different view of what a stock or index may be doing in the intermediate term. As you know, we bring you a weekly analysis of the S&P 500 at the start of each week, allowing us to filter out noise to find the longer-term trend.
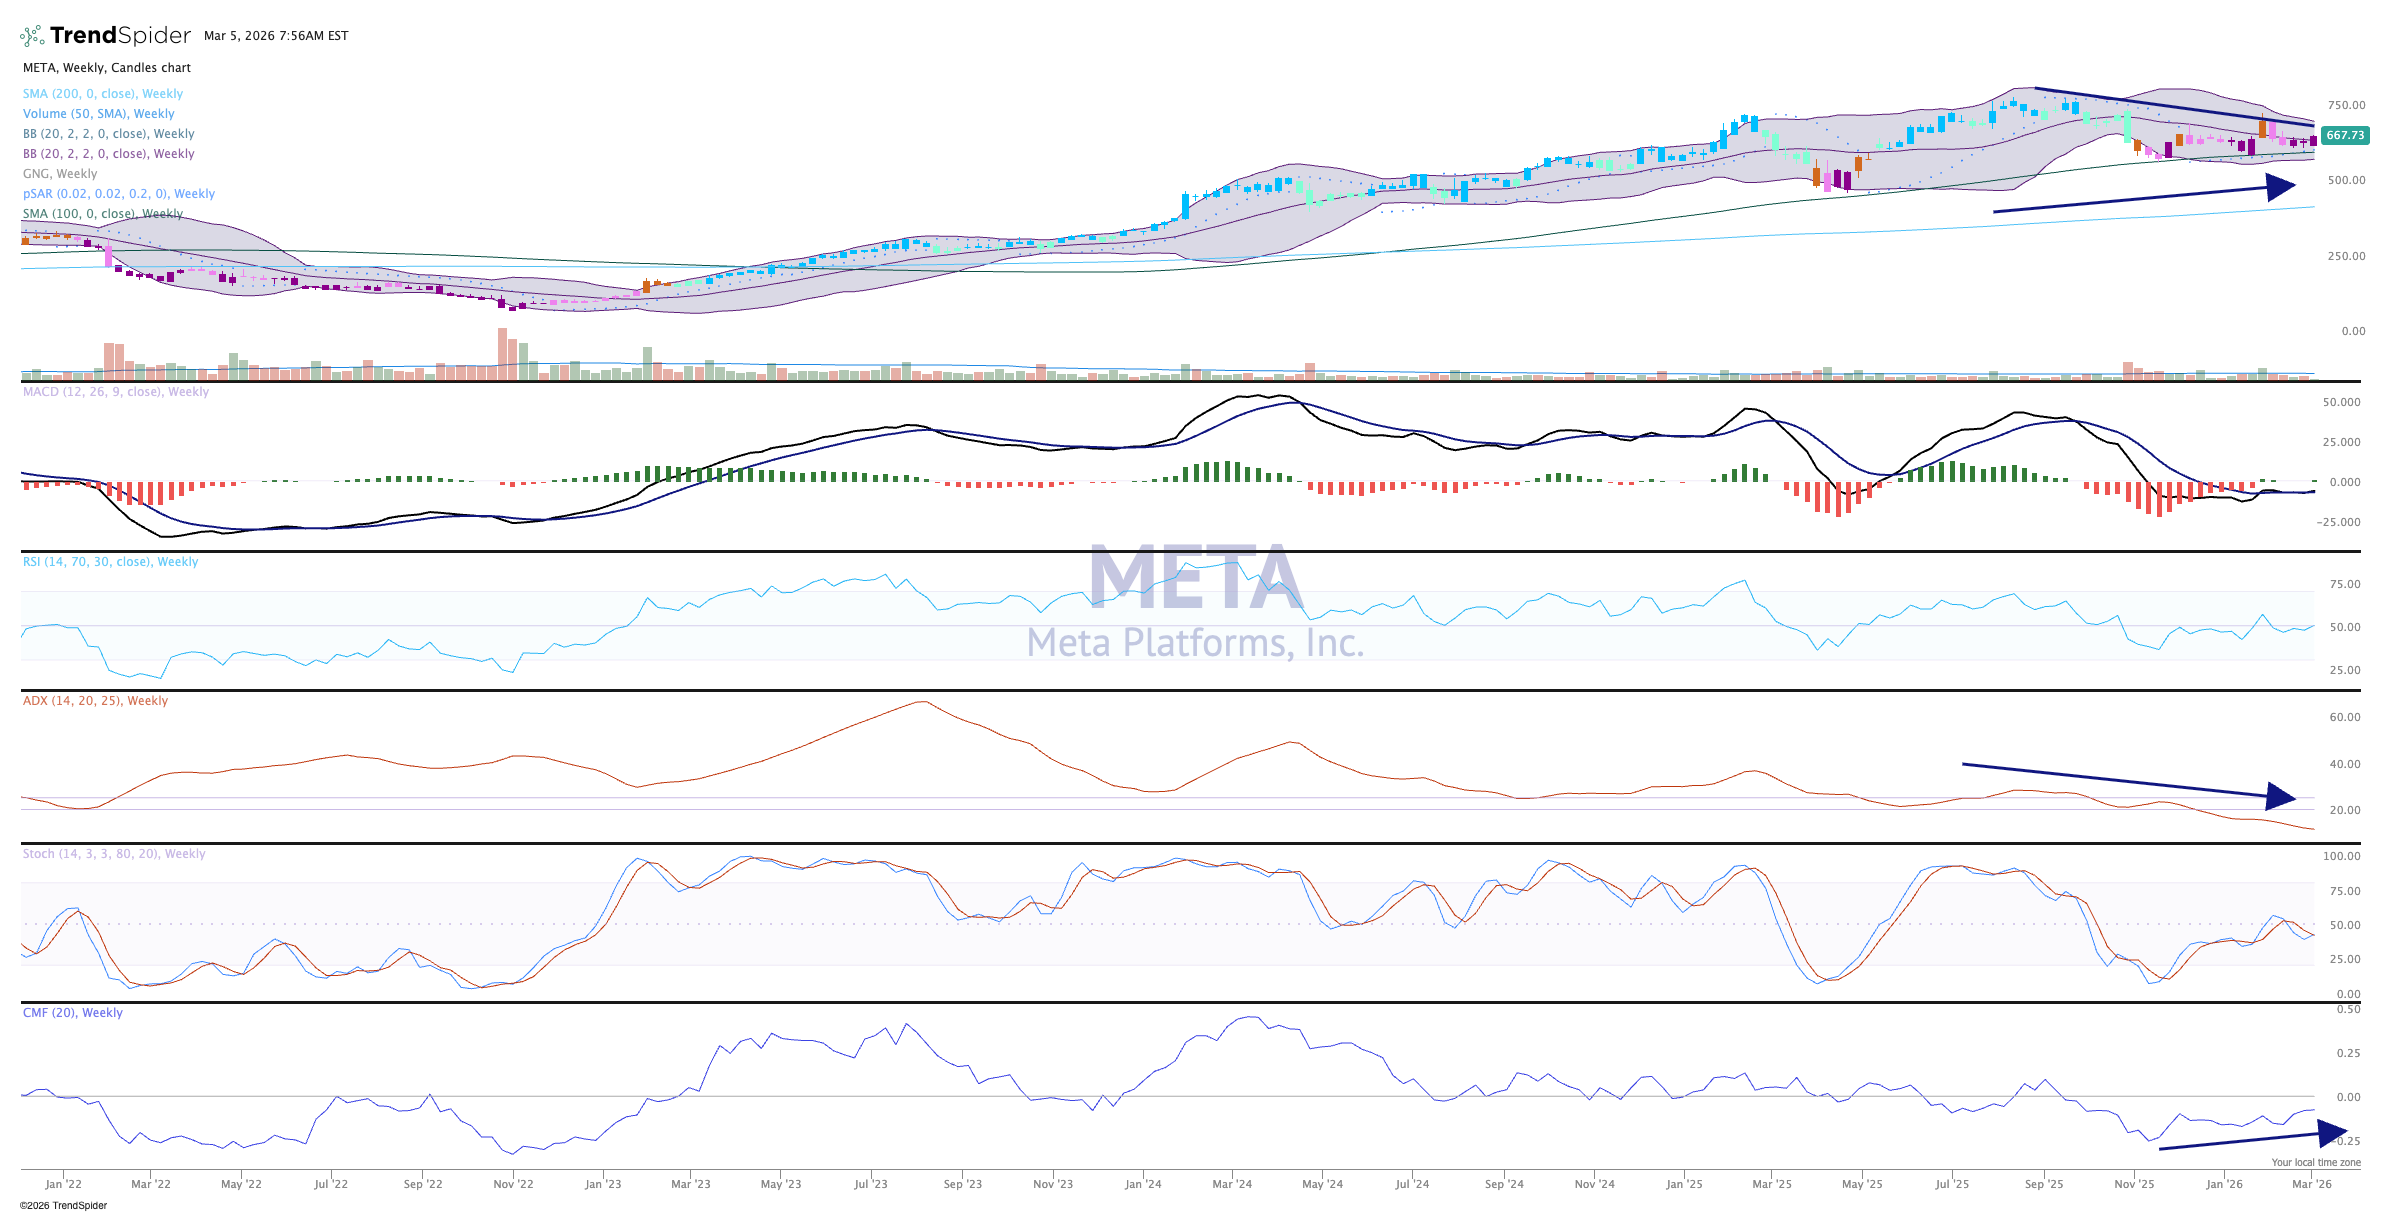
We'll look at Meta Platforms (META) today on a weekly chart, and notice the characteristics are quite similar to the daily chart (not shown). For one, the candles are pink/purple, which is bearish. On the weekly chart, however, that means Meta has been bearish for several weeks and is just trying to get out from under the table.
One could argue Meta is just in a very wide range, from $600-750. There is no trend here, the ADX is at strong levels (pane 4) while stochastics (momentum) is turning down. Money flow as been weak for some time, and the MACD is flat.
While the daily chart looks rather volatile the weekly chart here shows Meta to be more stable and right at support. Perhaps a bit more time needs to pass before this stock starts to make a move.
We like Meta Platforms in TheStreetPro Portfolio and rate it a One, or "buy at anytime."
More Pro Portfolio:
- Selling Off Some Public Safety Shares After Big Gain
- Tracking 24 Portfolio Signals Across 9 of Our Investing Themes
- February Monthly Roundup: Uncertainty and Volatility Jump in Roller Coaster Market
At the time of publication, TheStreetPro Portfolio was long META.
