Chart of the Day: Why 'Now' May Be the Time for This Holding
The big cloud and data company is poised for breakout from these levels.
You've reached your free article limit
You've read 0 of 1 free Pro articles.
Reading the charts of stocks during the quiet period just before earnings season gets underway can provide a great deal of information. They can tell us when a stock looks ready to move up or down into the future, which is the answer to the golden question: Which way is it going? Of course, there are no guarantees but if we take an objective view of a stock chart then we can come up with scenarios for movement that have strong possibilities and odds of happening.
We see the potential for a big move higher in ServiceNow NOW, which has quietly been moving through a triangle pattern and now has pushed above it and confirmed. That is important for a new uptrend to be established. Note, the ADX (pane 3) is not showing much of a trend here, but the momentum (stochastics, pane 4) is starting to build.
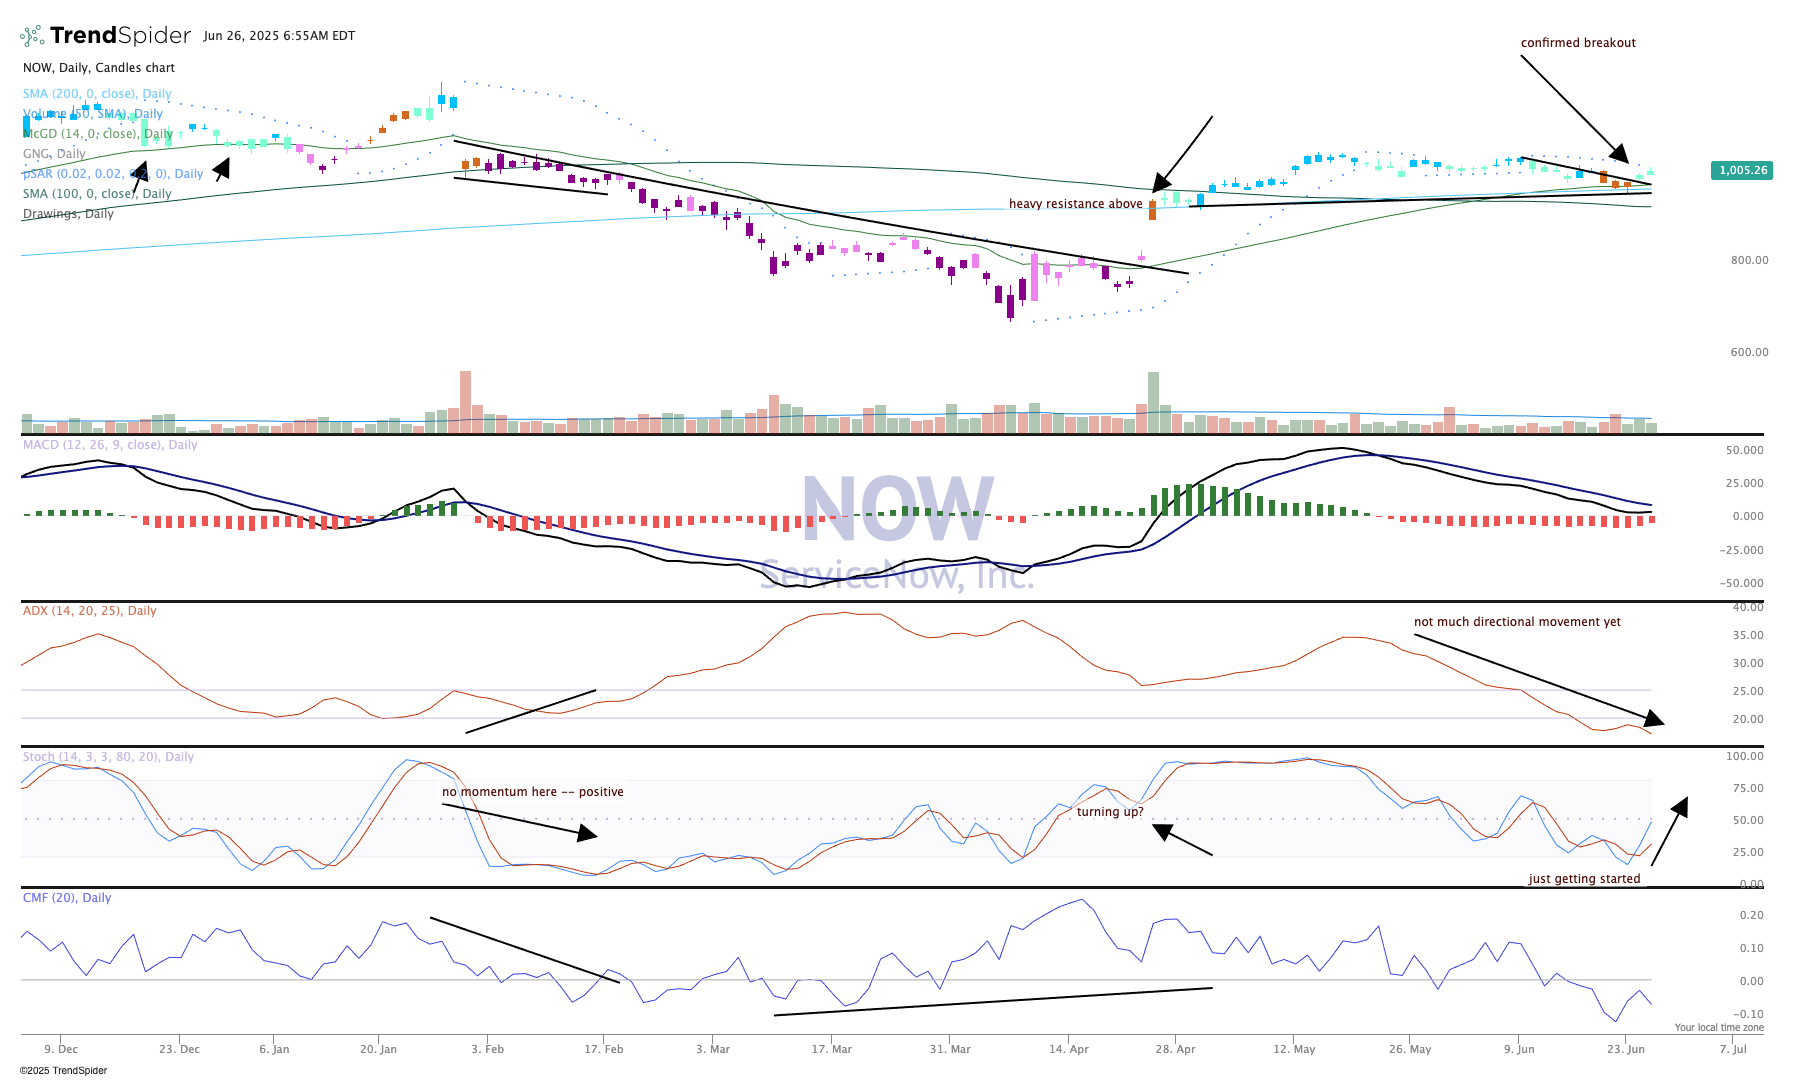
Money flow remains weak and unless that improves we could see levels capped on the way up. There is a big gap to fill on the upside from back in January at the $1,144 level, so that would be roughly 10% higher than current levels.
ServiceNow reports in late July, and volatility should start to pick up as we move into the new month, but keep your eyes on this one. If this breakout above this triangle lasts there is good upside potential.
We like ServiceNow in TheStreet Pro Portfolio and rate it a One, or "buy at anytime."
At the time of publication, TheStreet Pro Portfolio was long NOW.
