Chart of the Day: What's Next for Amazon After the Stock's 'Stunning' Move?
We always defer to the price chart to give us a read on trend.
You've reached your free article limit
You've read 0 of 1 free Pro articles.
The massive move by Amazon AMZN since the lows in April still did not come close to all-time highs. That move, a whopping 42% rise over about four months, was stunning. We noted back in June (on the chart) that a move above the resistance line would set up a very strong move higher, and that happened in July.
But this month the stock has been taking long-needed breather. Amazon has little news to move on so a sideways consolidation makes sense until next earnings season gets underway. You may be frustrated with sideways action but it is part of a base-building process that is necessary for a stock to experience before moving to the next level.
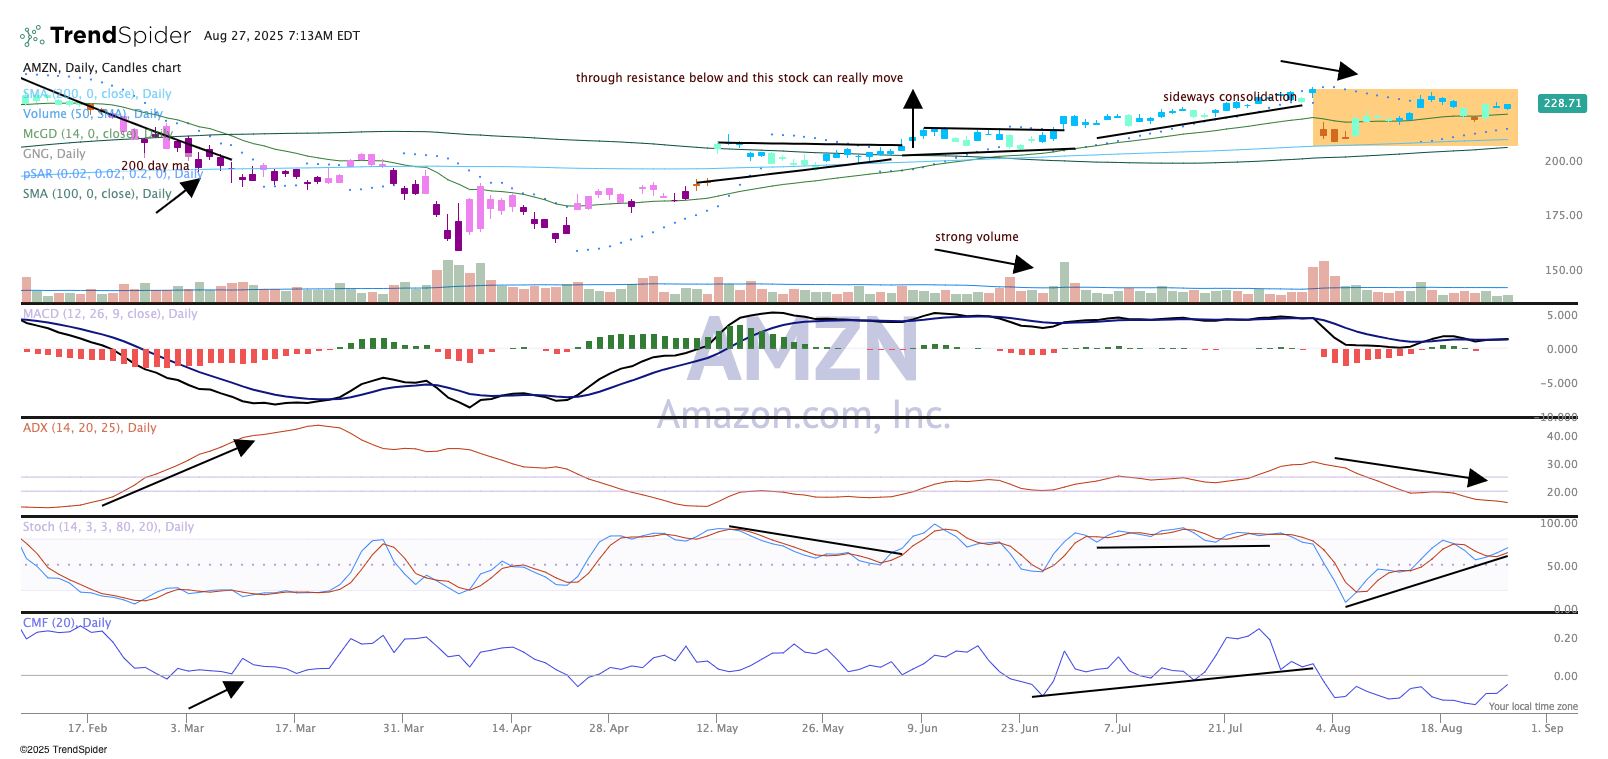
Indicators are not in great condition, as you might imagine, with the price action just going horizontal. Yet, the candles are blue/teal, which indicate bullish on the GoNoGo composite of indicators. We'll defer always to the price chart to give us a read on trend.
Money flow is still poor, as some big sellers recently exited the name but appear to be coming back to the stock. ADX is flat, meaning there no trend in place.
We'll be patient here with Amazon, which we rate a One in the Pro Portfolio, or "buy at anytime."
At the time of publication, TheStreet Pro Portfolio was long AMZN.
