Chart of the Day: What to Watch With Apple
The stock has made a series of lower highs, lower lows. We know what that means...
You've reached your free article limit
You've read 0 of 1 free Pro articles.
 Apple Holds Event To Showcase New Release Of iPhones, Watches and AirPods
As we move through a challenging period for technology stocks (the group as a whole has been lagging performance), we always need to look at the prior leadership to get an idea of how things are moving. Apple (AAPL) is without question the leader, even if it is only #2 in valuation behind Nvidia (NVDA) . It has often been said, "As Apple goes, so goes the rest of the tech firms."
Apple has been a laggard but still remains within a rather tight range. The chart is currently bearish with purple candles on the chart. The GoNoGo composite of indicators is clearly bearish, supported by bearish indicators on the moving average convergence divergence (MACD) and stochastics (momentum).
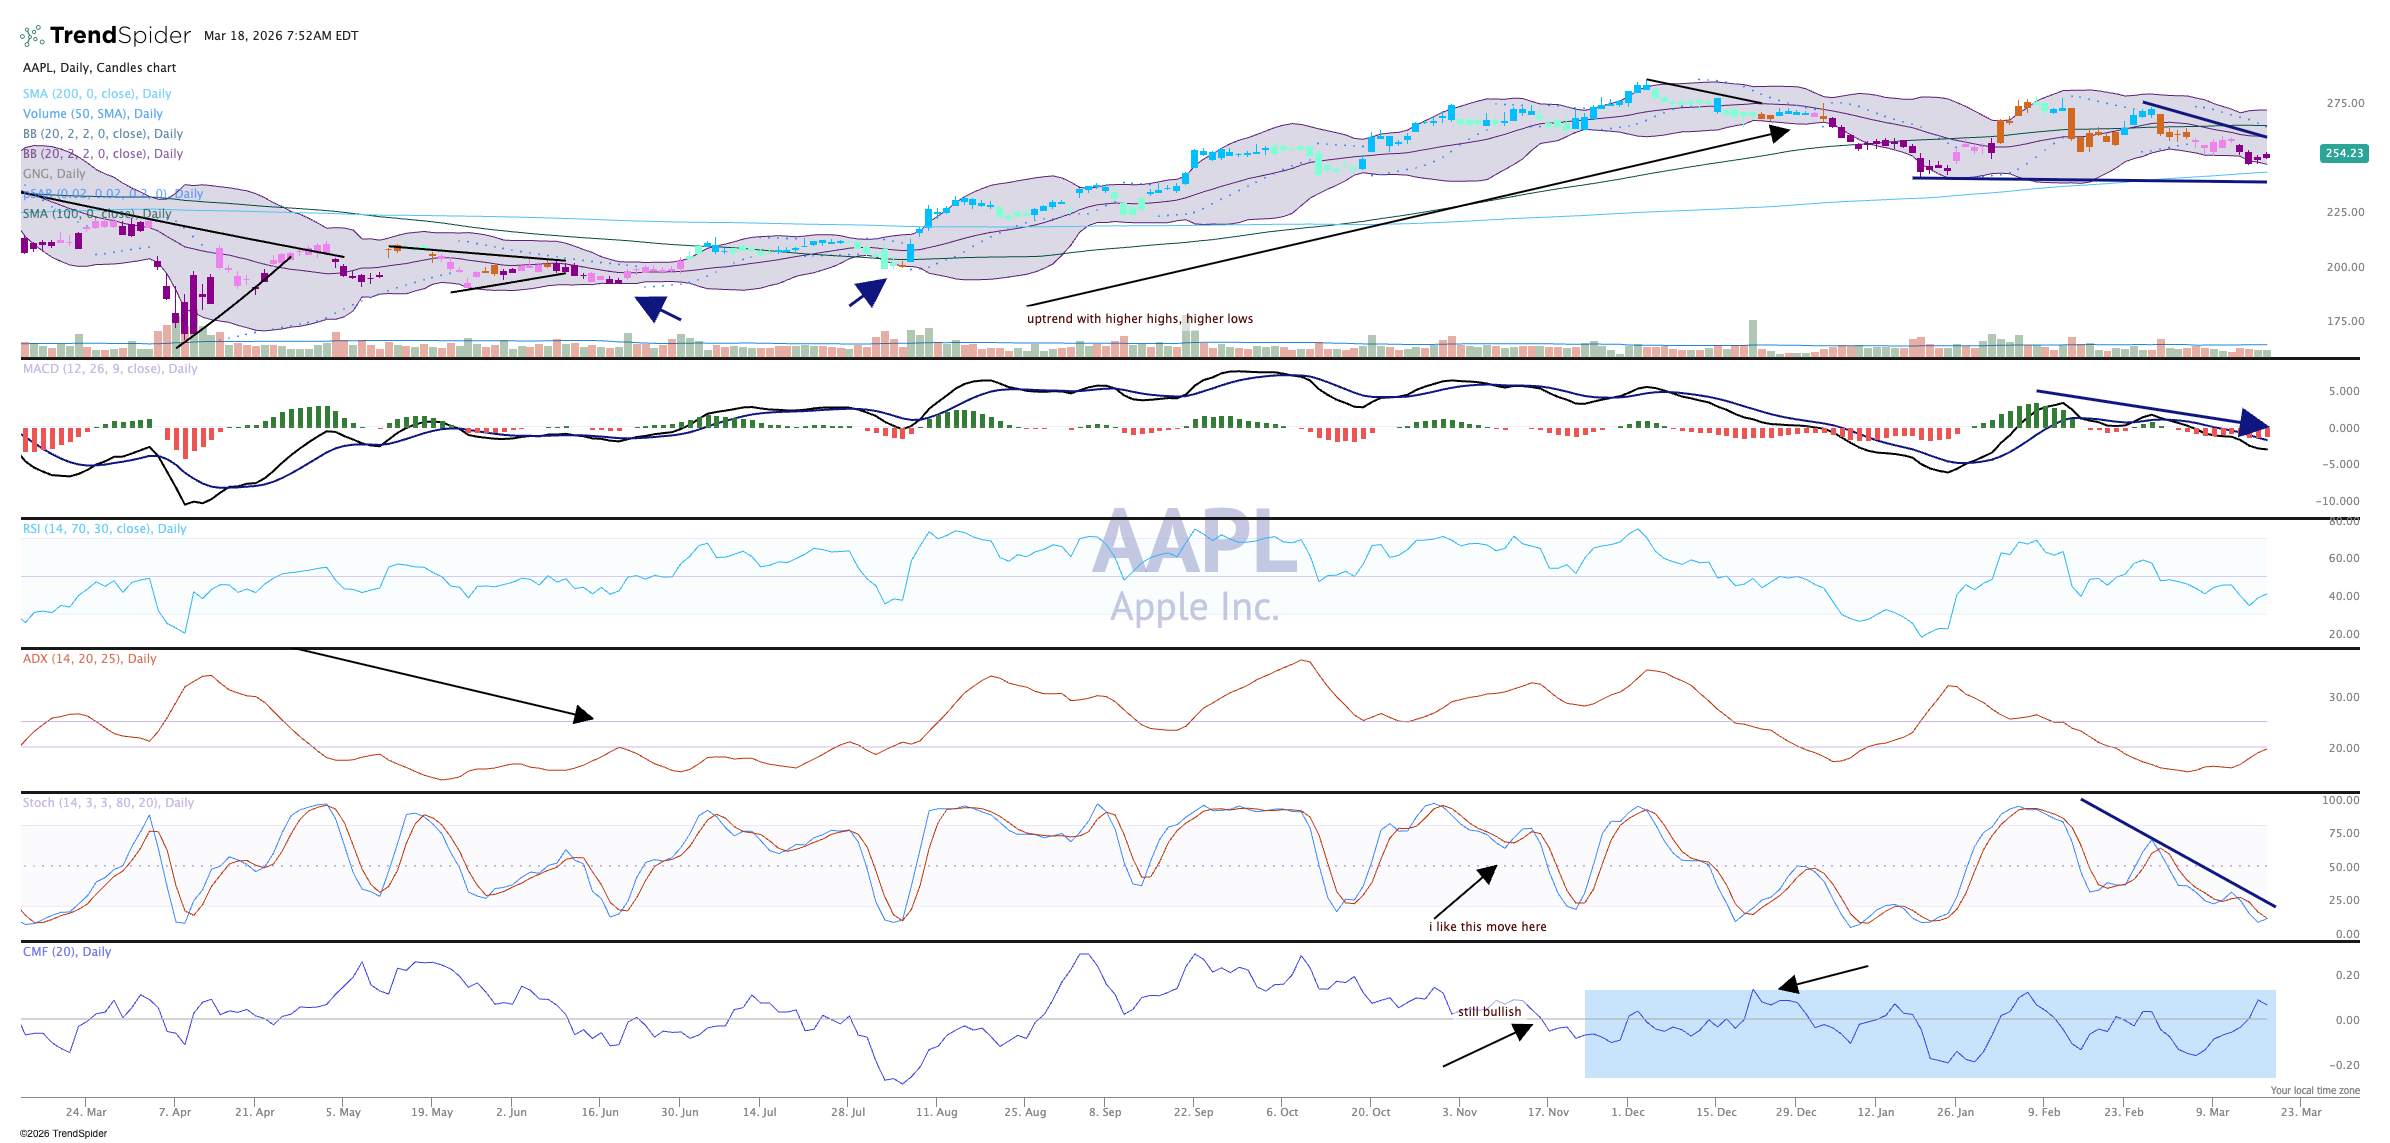
The ADX is turning up here, which means the trend is getting stronger (that trend is down). The January lows and the 200-day moving average are in view (call it $245-ish), and if that gets tested a decision point will be made (to buy or to sell). We have often seen buyers step in at the 200-day; that happened in June and August last year (left side of the chart), but conditions were different and the stock chart was not bearish.
Money flow is actually positive so perhaps big money dip buyers are stepping in to add shares here. That is the only positive we can glean from the chart at this time.
A move above $262 could get Apple moving back up over the coming months. Earnings are out in about six weeks.
We still like Apple in TheStreet Pro Portfolio and rate it a Two, or "stockpile on pullbacks."
Related: New Uber Price Target After Nvidia Deal Challenges Tesla
More Pro Portfolio:
- We're Adding to Two Financial Holdings, While Upgrading One
- We're Tracking 24 Portfolio Signals Across 9 of Our Investing Themes
- Weekly Roundup: Iran and Energy Worries Take Their Toll on the Market
At the time of publication, TheStreet Pro Portfolio was long AAPL and NVDA.
