Chart of the Day: We're Banking on Morgan Stanley to Lead the Pack
The stock just powered up after a modest pullback and is looking strong compared to its peers.
You've reached your free article limit
You've read 0 of 1 free Pro articles.
 Morgan Stanley Stock Looks Headed Lower
Morgan Stanley (MS) will release first-quarter earnings on Wednesday before the open. Investors are fairly optimistic MS will beat and provide strong guidance. Others in the financial group, like JP Morgan (JPM) and Goldman Sachs (GS) , beat but offered a more tempered view of the future.
Related: After Goldman's Q1 Beat, Keep Close Eye on This Key Indicator
While the same probably applies to Morgan Stanley, the company has managed to rise above perceived risks and outshine the competition. We believe this will be the case here as the stock pushes toward all-time highs about 4% higher than current levels.
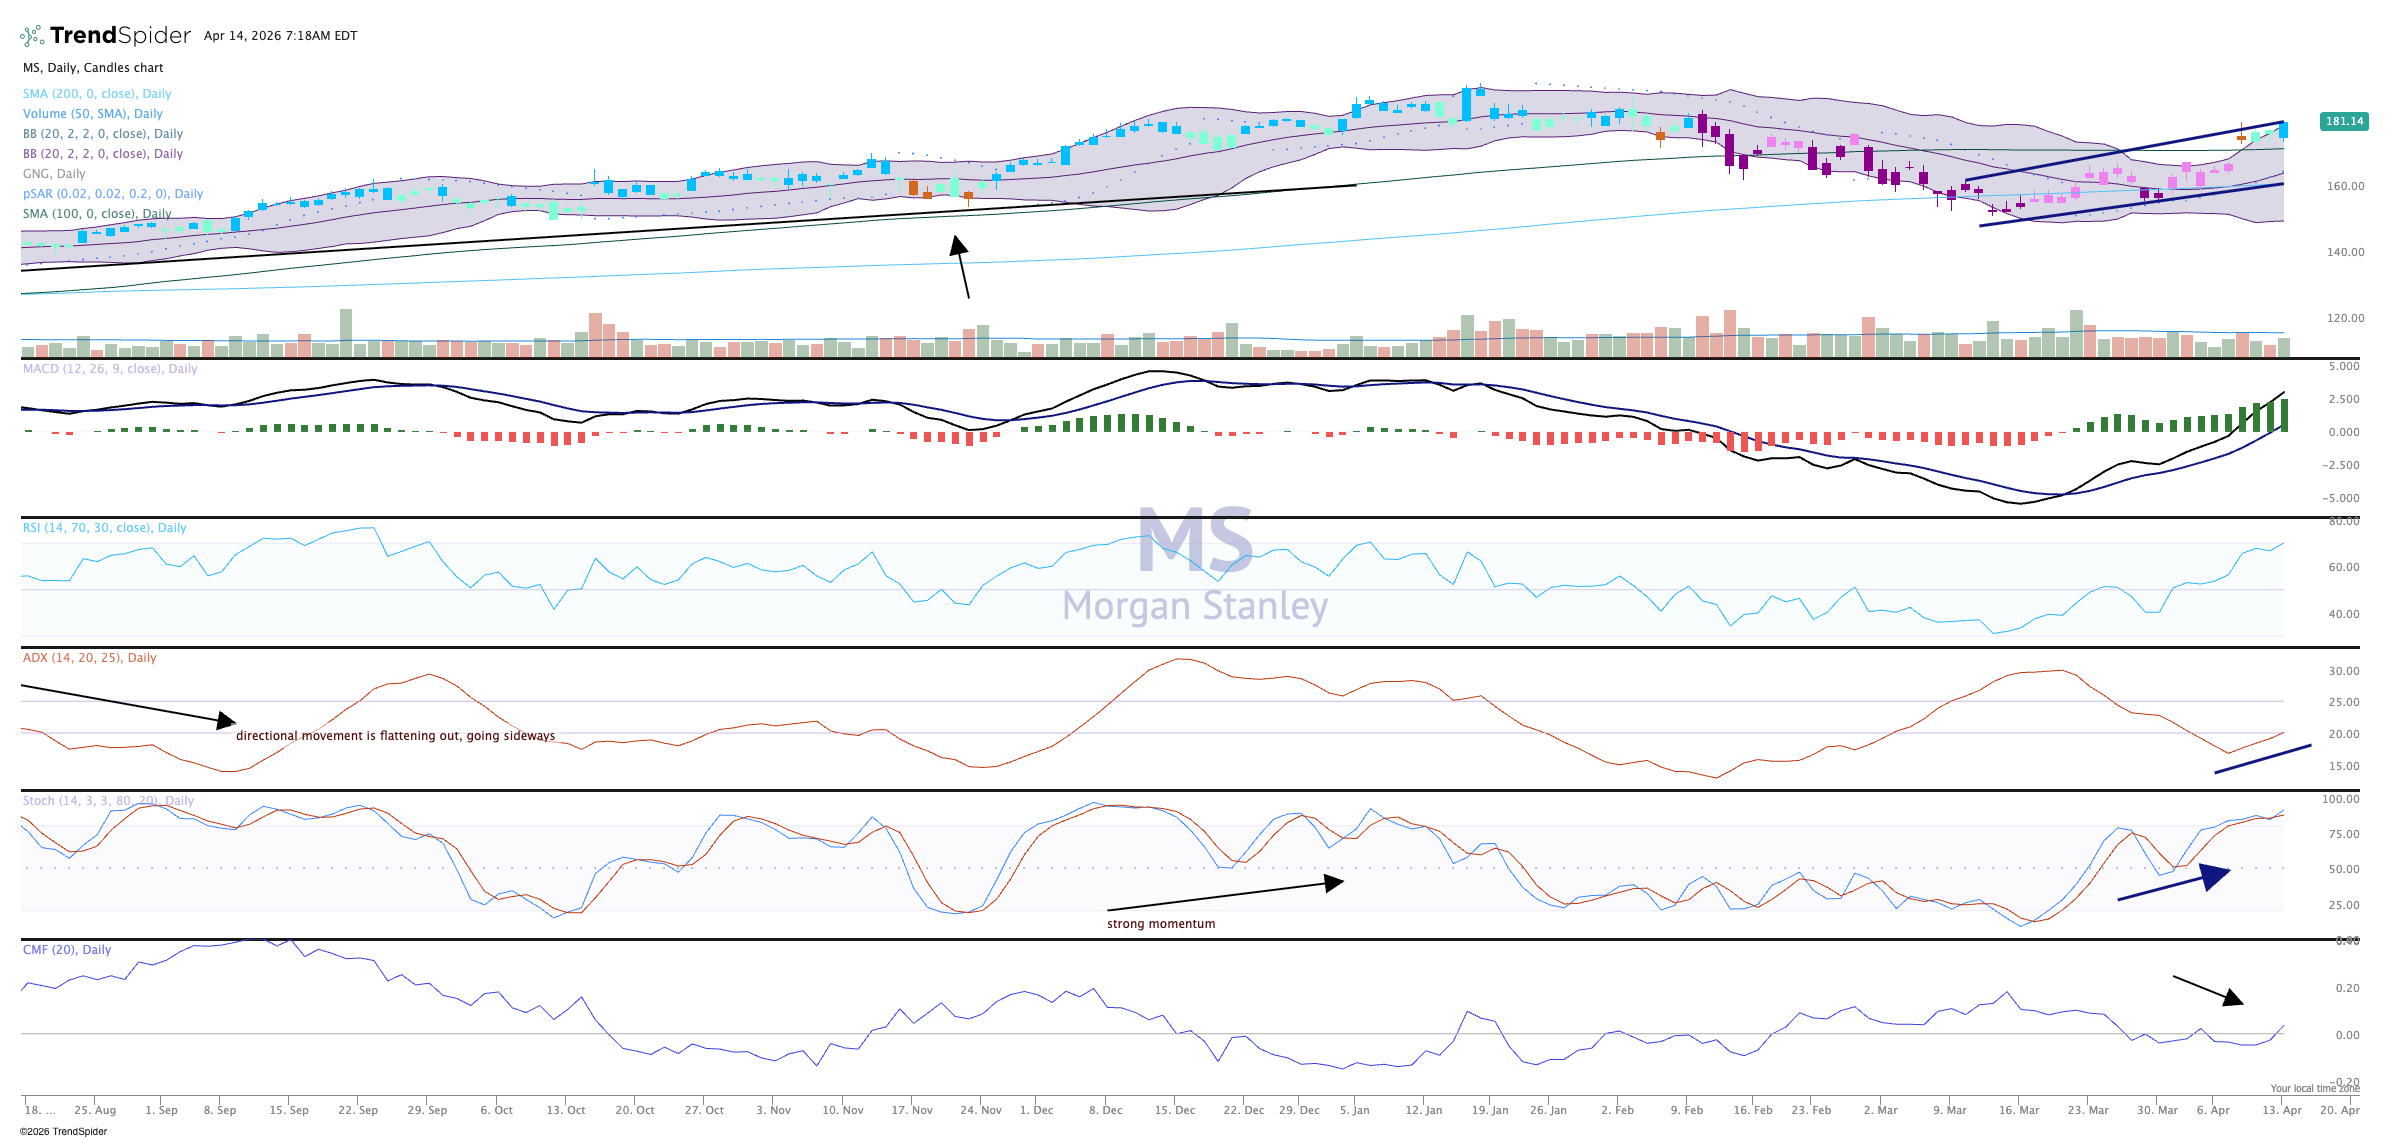
The chart is strong and building on recent bullish price action. The chart is now bullish, reflecting a blue candle at the top. The GoNoGo composite of indicators, as seen in the top pane, states this is a strong bullish construct. The moving average convergence divergence in the pane below, meanwhile, has been on a buy signal for about a month now. Money flow at the bottom of the chart just went above the zero-line.
Momentum, as seen in the stochastics on pane 5, is strong and overbought but can stay that way for quite some time. Relative strength is very impressive especially over the last couple weeks when the stock market has been so strong.
We like Morgan Stanley in TheStreet Pro Portfolio and rate it a One, or "buy at anytime."
At the time of publication, MS is a holding in the Pro Portfolio.
