Chart of the Day: This Key Level Could Signal Labcorp's Move Higher
The stock is building a nice base at the higher end of the range.
You've reached your free article limit
You've read 0 of 1 free Pro articles.
Stocks go through periods of basing while moving through time. Surprisingly, it is not all boom/bust, as a rest period is often needed as a time to allow investors to either get on board or unload shares. In a bullish situation like Labcorp LH, the stock is basing in the top end of the range, a period of consolidation, which is often followed by a move in the previous direction. In this case, that would be higher.
So, the golden question you may ask is, "When will this stock make that move higher?" That is the mystery of course: The charts only give you past information but based on prior behavior we can imply what that next move would look like. If we see on the left side of the chart a few basing periods, which resolved higher, then we can infer the same would happen under the current conditions. No guarantee of course.
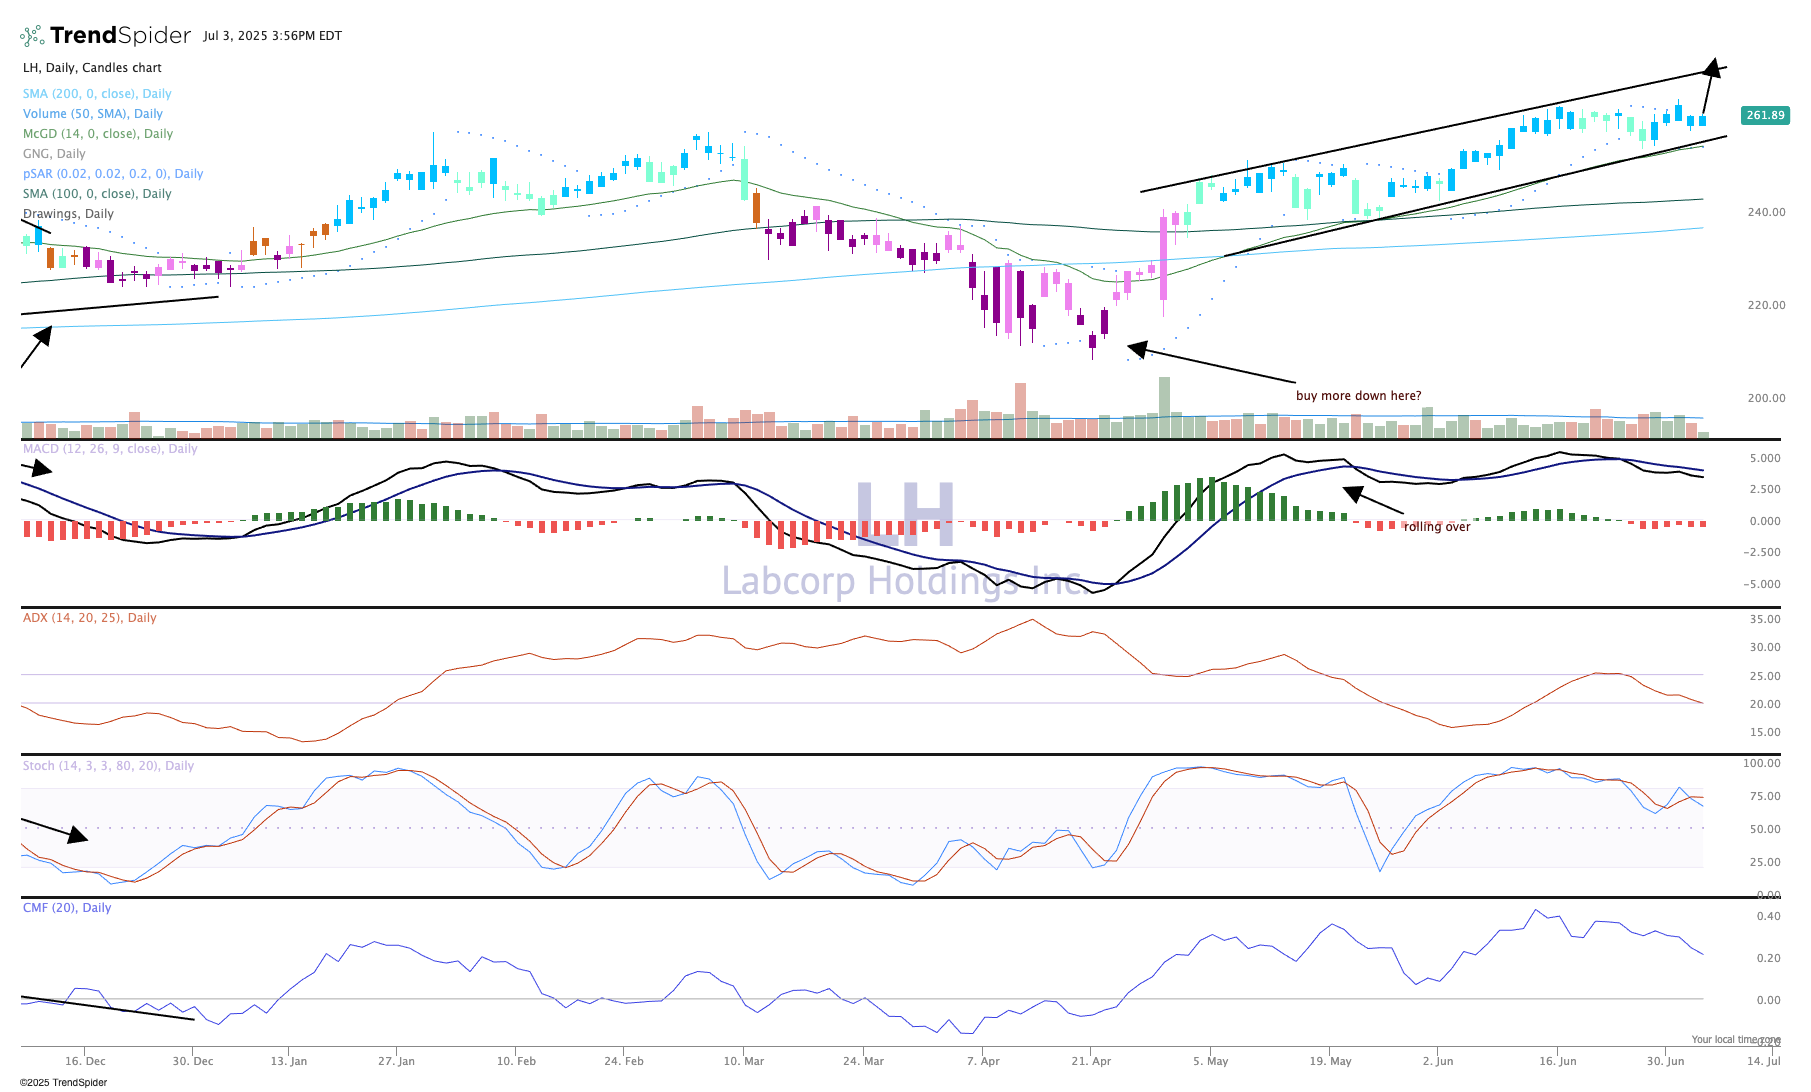
The indicators are not bullish, but the reason for that is the chart is no longer accelerating as it was in May and June. We would say the indicators are simply not bullish rather than say they are bearish. The candles at the top pane are blue, which say the chart is very bullish according to the GoNoGo composite of indicators. A move above the recent high, call it $265, would be bullish and imply a move to $300 or more.
We like Labcorp in TheStreet Pro Portfolio and rate it a Two, or "stockpile on pullbacks."
The Pro Portfolio is long Labcorp.
