Chart of the Day: Universal Display Quietly Turns Bullish
Without the noise from earnings season, we see big money starting to add shares.
You've reached your free article limit
You've read 0 of 1 free Pro articles.
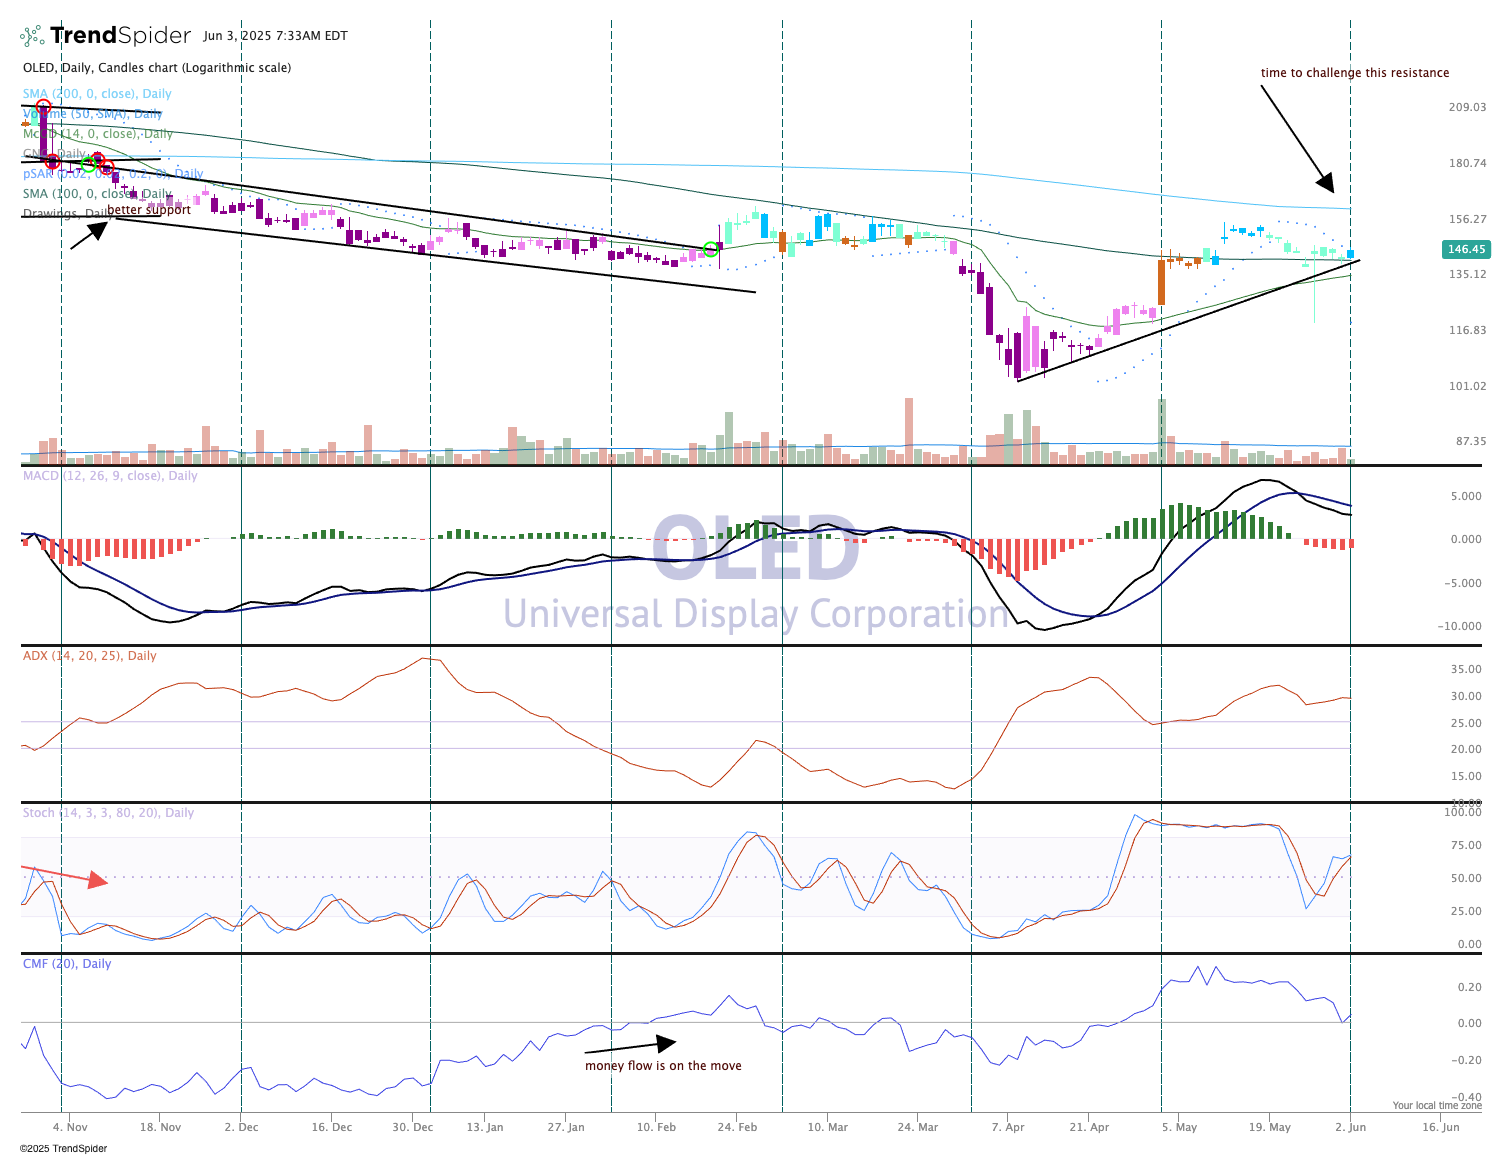
Universal Display OLED had a remarkable run from those lows in April but now the stock is moving sideways. But what we find interesting after that strong move up is the candles showing mostly teal and blue.
Those are bullish characteristics on the GoNoGo composite of indicators, and while the chart does seem to show some slowing of the recent trend there is no disputing the fact these candles are bullish. We always consider the price chart as the primary indicator, hence he give this the strongest weighting in our analysis.
The other secondary indicators are mildly bullish with stochastics pointing upward and the ADX actually pretty strong in the 30 range (pane three). What is impressive about this latest move down then up is a test of the 200-day moving average (shown with the sloping trend line). A bounce off this level creates another higher low, and with that the uptrend continues. The stock continues to ride the coattails of phone and other hardware manufacturers. On the chart, a break above $155 would be extremely bullish.
We like OLED in TheStreet Pro portfolio and rate it a one, buy at anytime.
More Pro Portfolio: (updated June 2)
- We're Cashing Out of This Holding After a Big Move
- Monthly Roundup: A Good May for the Market. Even Better for the Portfolio
- Apple Glasses, AI Travel Agents, Aging States and More News for Investing
At the time of publication, TheStreet Pro Portfolio was long OLED.
