Chart of the Day: This T-Mobile Indicator Is Ringing and We're Listening
The bullpen name has retreated to a long-term support level and we're watching.
You've reached your free article limit
You've read 0 of 1 free Pro articles.
A recent pullback by bullpen name T-Mobile TMUS sets up an interesting situation that has caught our attention.
The move down to the 200-day moving average has found some good support, but we still need to see more to make sure that level is solid and holding. Indicators, however, are not showing bullish qualities, in fact just the opposite. Momentum is turning down. In the second pane in the chart, we can see the Moving Average Convergence Divergence is on a sell signal. Money flow, in the second to bottom pane, is negative.
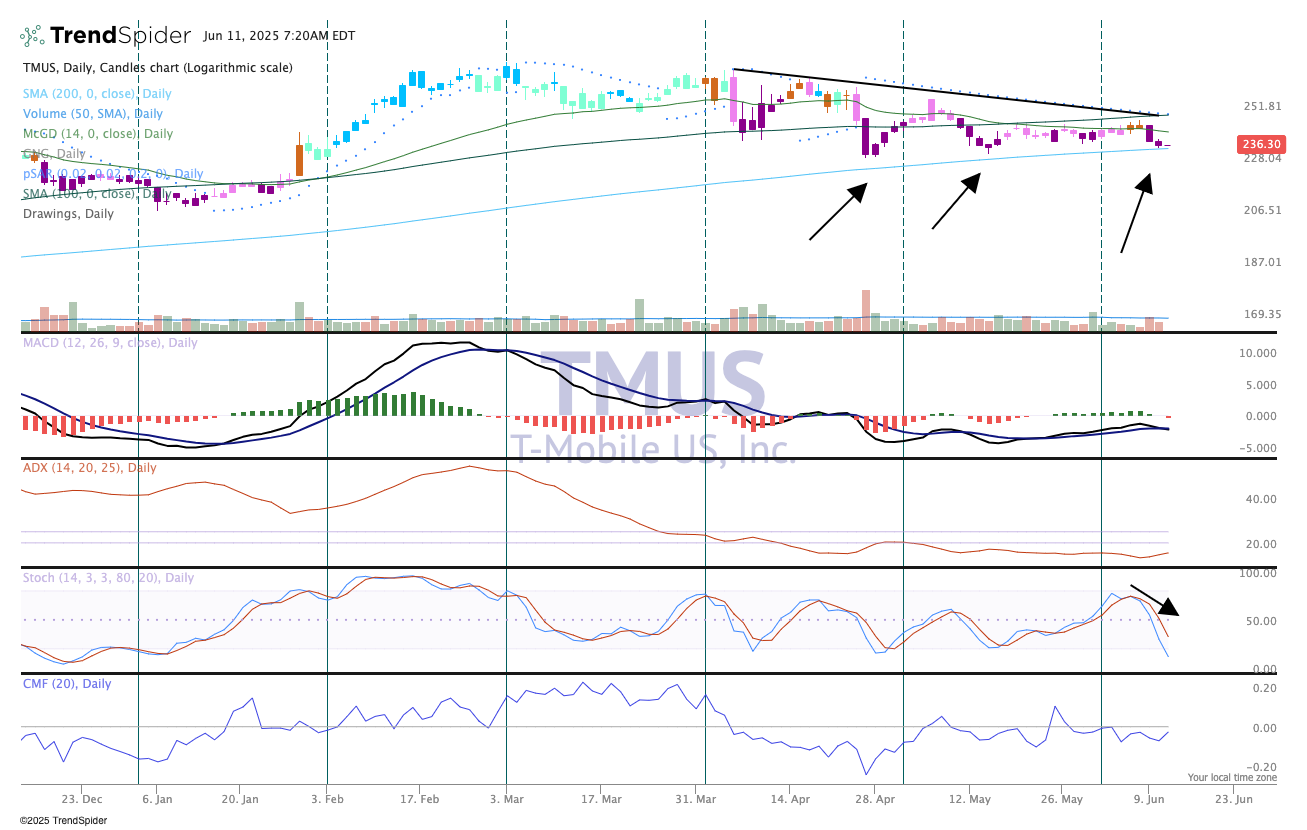
So why is TMUS interesting here? Once again, we look at the price chart as the primary indicator and notice recent tests of the 200-day moving average were successful, even as the indicators were not bullish at the time. We're still on the sidelines here, but are watching this stock chart closely. If it breaks lower the thesis is wrong and there are lower prices toward the $200 level to be tested.
At the time of publication, the Pro portfolio had no position in any security mentioned.
