Chart of the Day: This Indicator Shows Danger Ahead for Dutch Bros
BROS is sitting below its 200-day moving average in front of earnings, which is a perilous brew.
You've reached your free article limit
You've read 0 of 1 free Pro articles.
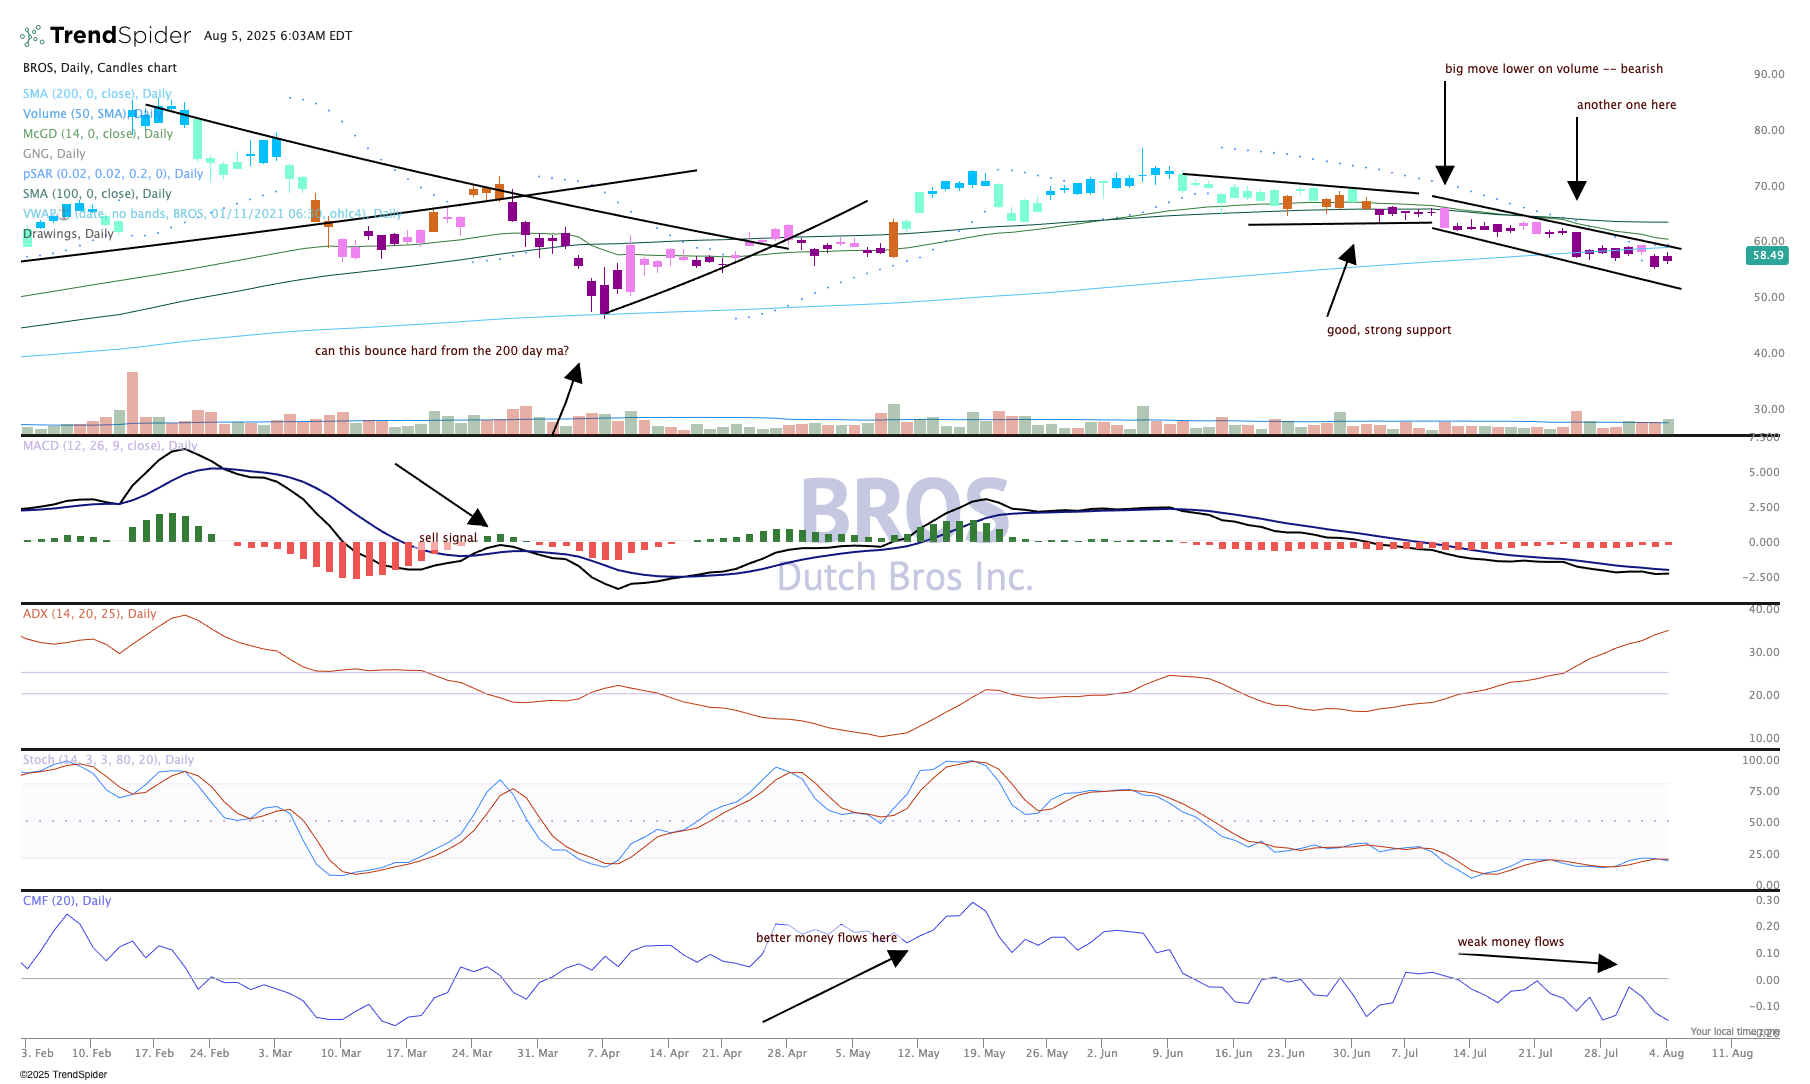
It has been a difficult month for Dutch Bros BROS. The last time we checked in on the stock it appeared to have very strong support at a base that flirted with the 200-day moving average. But we understood that if the stock could not "clear" that base and move up, there was some downside concern. That was evident following a sharp down day in mid-July followed up with another heavy down day just 10 sessions later. That sealed the deal on the trend, which is down as the indicators show supporting bearish signs, too.
The Moving Average Convergence Divergence, as seen in the second pane, is solidly on a sell signal, but is quite overbought, so a turn higher could happen any day. Money flow, which is graphed in the bottom pane, is poor. The Average Directional Index, in the middle pane, is overdone and showing a strong bearish trend. Candles are purple and pink, we know that means bearish on the GoNoGo composite of indicators at the top.
Earnings are out for BROS later in the week. The chart seems to indicate they will not be good, as the big money is not interested in taking a bullish position. We'll have to see how the market takes their earnings, competitor Starbucks SBUX rose up and gave back strong gains last week.
We like Dutch Bros in TheStreet Pro Portfolio and rate it a Two, or "stock pile on pullbacks."
At the time of publication, The Pro Portfolio was long BROS.
