Chart of the Day: This Holding Shows Good Flexibility
As the company approaches an important earnings date, we continue to see buyers stepping up.
You've reached your free article limit
You've read 0 of 1 free Pro articles.
When a stock moves sharply with no earnings or news to explain why then we pay close attention. Such is the case with Elastic N.V. ESTC the prior week, which moved up on big volume but no news to consider. That tells us big money is coming after the stock.
Notice the indicators are in agreement with that thesis. The MACD (moving average convergence/divergence) is on a buy signal and while the stochastics (momentum) in pane 4 seem to be slowing down, they look to simply be taking a rest.
Money flow has improved greatly over the past several weeks and is back to the positive side. in the top pane the candles have been blue/teal, which reflects bullishness in the GoNoGo composite of indicators. Also, the parabolic SAR (stop and reverse system) has been bullish since a turn up in the middle of January.
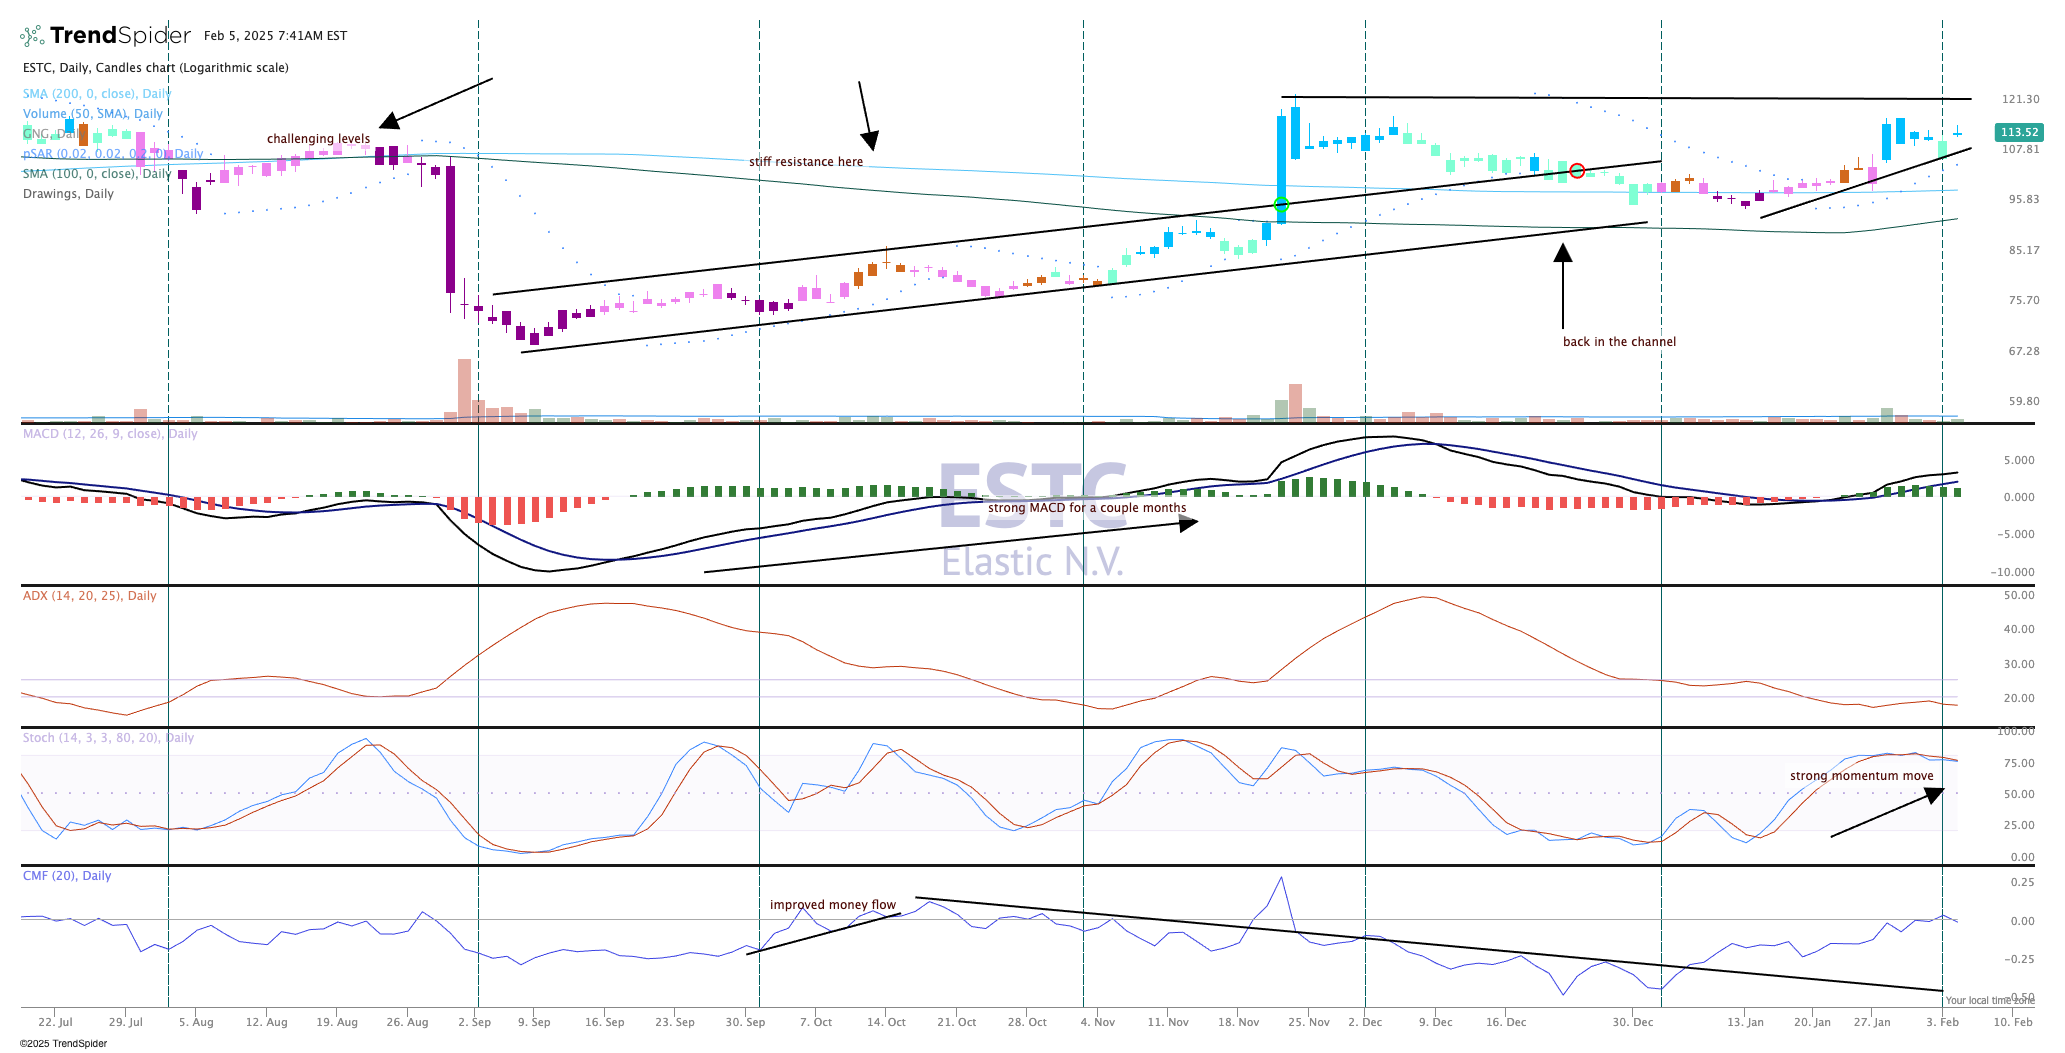
All in all, Elastic's chart shows good price action, right near the high levels of the last earnings blowout (see the big candle moves in November). We often see these big surprise beats come in threes (not always, though), so we are looking for more upside here into March.
We like Elastic in TheStreet Pro Portfolio and rate it a One, or "buy at anytime."
At the time of publication, TheStreet Pro Portfolio was long ESTC.
