Chart of the Day: ServiceNow Is Building the Bullish Case
A minor uptrend is key here as the stock jumps some heady resistance.
You've reached your free article limit
You've read 0 of 1 free Pro articles.
We have spoken before about the challenges of the ServiceNow NOW chart. As you recall, we noted a nice strong base from the spring that turned into a nightmare downtrend following its earnings release in July.
That move down was sharp and painful, but as we can see below, the stock found good support just above the $800 level. That solid support has held up nicely as the bulls try to take advantage of the bullish market conditions.
No question this stock chart makes us skeptical, but the recent buying interest has us a bit more enthusiastic about the future. Indicators remain bullish; the recent turn of the candle from amber (neutral) to teal (cautiously bullish) on the GoNoGo composite of indicators has us thinking there is more upside to go. Further, a quiet move above heady resistance (50-day moving average and the 14-period McGinley) is encouraging.
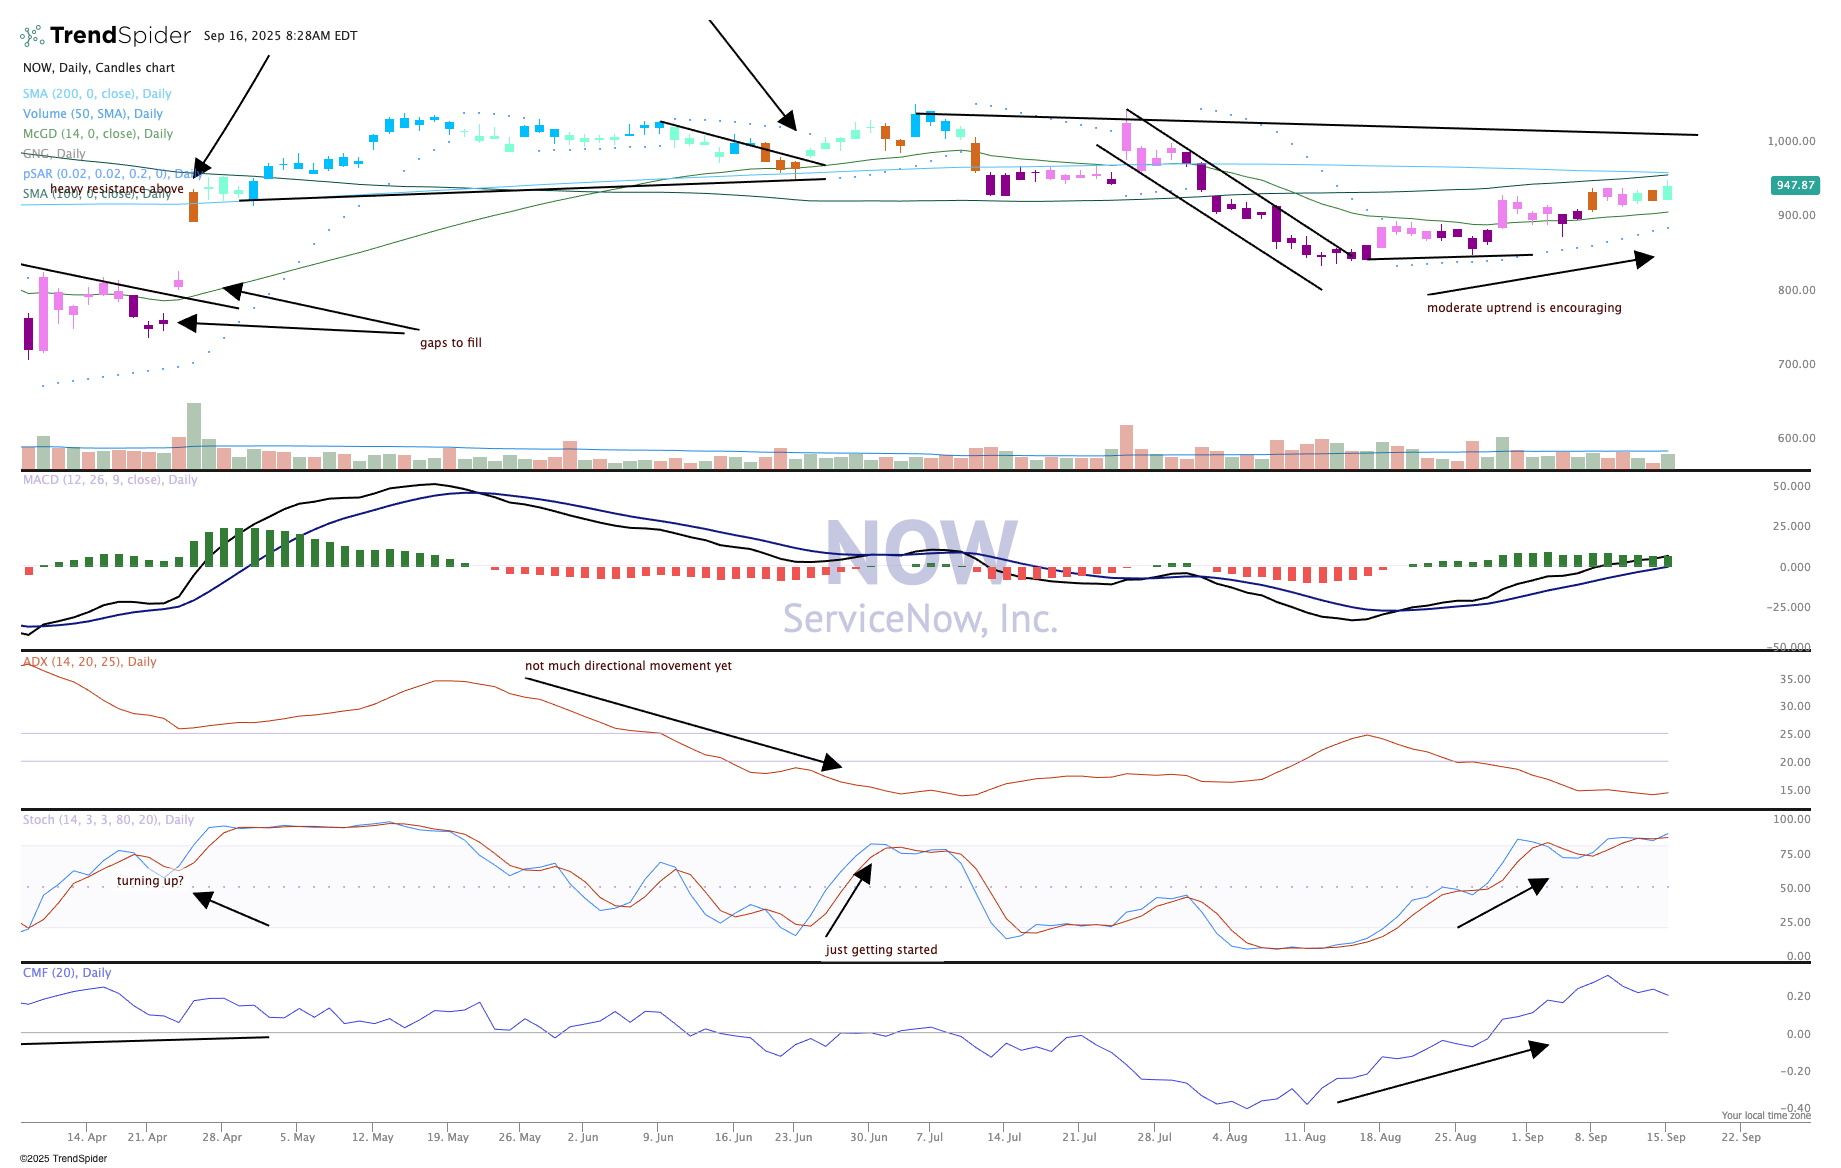
With few direct catalysts to drive this stock before the next earnings report in late October we'll be watching the action closely to see if the bulls can take this holding up to some resistance levels marked on the chart. That comes in just above $1,000.
We like ServiceNow in TheStreet Pro Portfolio and rate it a One, or "buy at anytime."
More Pro Portfolio:
- We're Ringing the Register on a Big Tech Play, Buying More of Another Holding
- Koreans Turn to Ralph Lauren; AI for the Elderly & More Investing News
- Weekly Roundup: Bracing for a 'Buy the Rumor, Sell the News' Fed Event
At the time of publication, TheStreet Pro Portfolio was long NOW.
