Chart of the Day: Our New Position Gave Us a Great Buying Opportunity
Testing recent support levels and holding firm is a bullish characteristic.
You've reached your free article limit
You've read 0 of 1 free Pro articles.
We added shares of TJX Cos. TJX to the Pro Portfolio this week after a modest pullback took the stock down about 10% from recent highs.
Notice on the chart below the massive ramp this name took in April and May. There was a very consistent pattern of higher highs and higher lows, but at some point we know the buyers are going to throw in the towel. That happened when TJX peaked in late May, which set up a nice test of moving averages and thus our recent purchase.
What we like about this stock chart is the pullback stopped at the key 200-day moving average, which has in the past stopped most declines. Last week saw TJX bounce sharply and hammer off that level. It now is in the process of building a base, with some higher lows.
We are confident that the $120-125 level is going to hold and if we get a pullback down to that range we are inclined to add more shares.
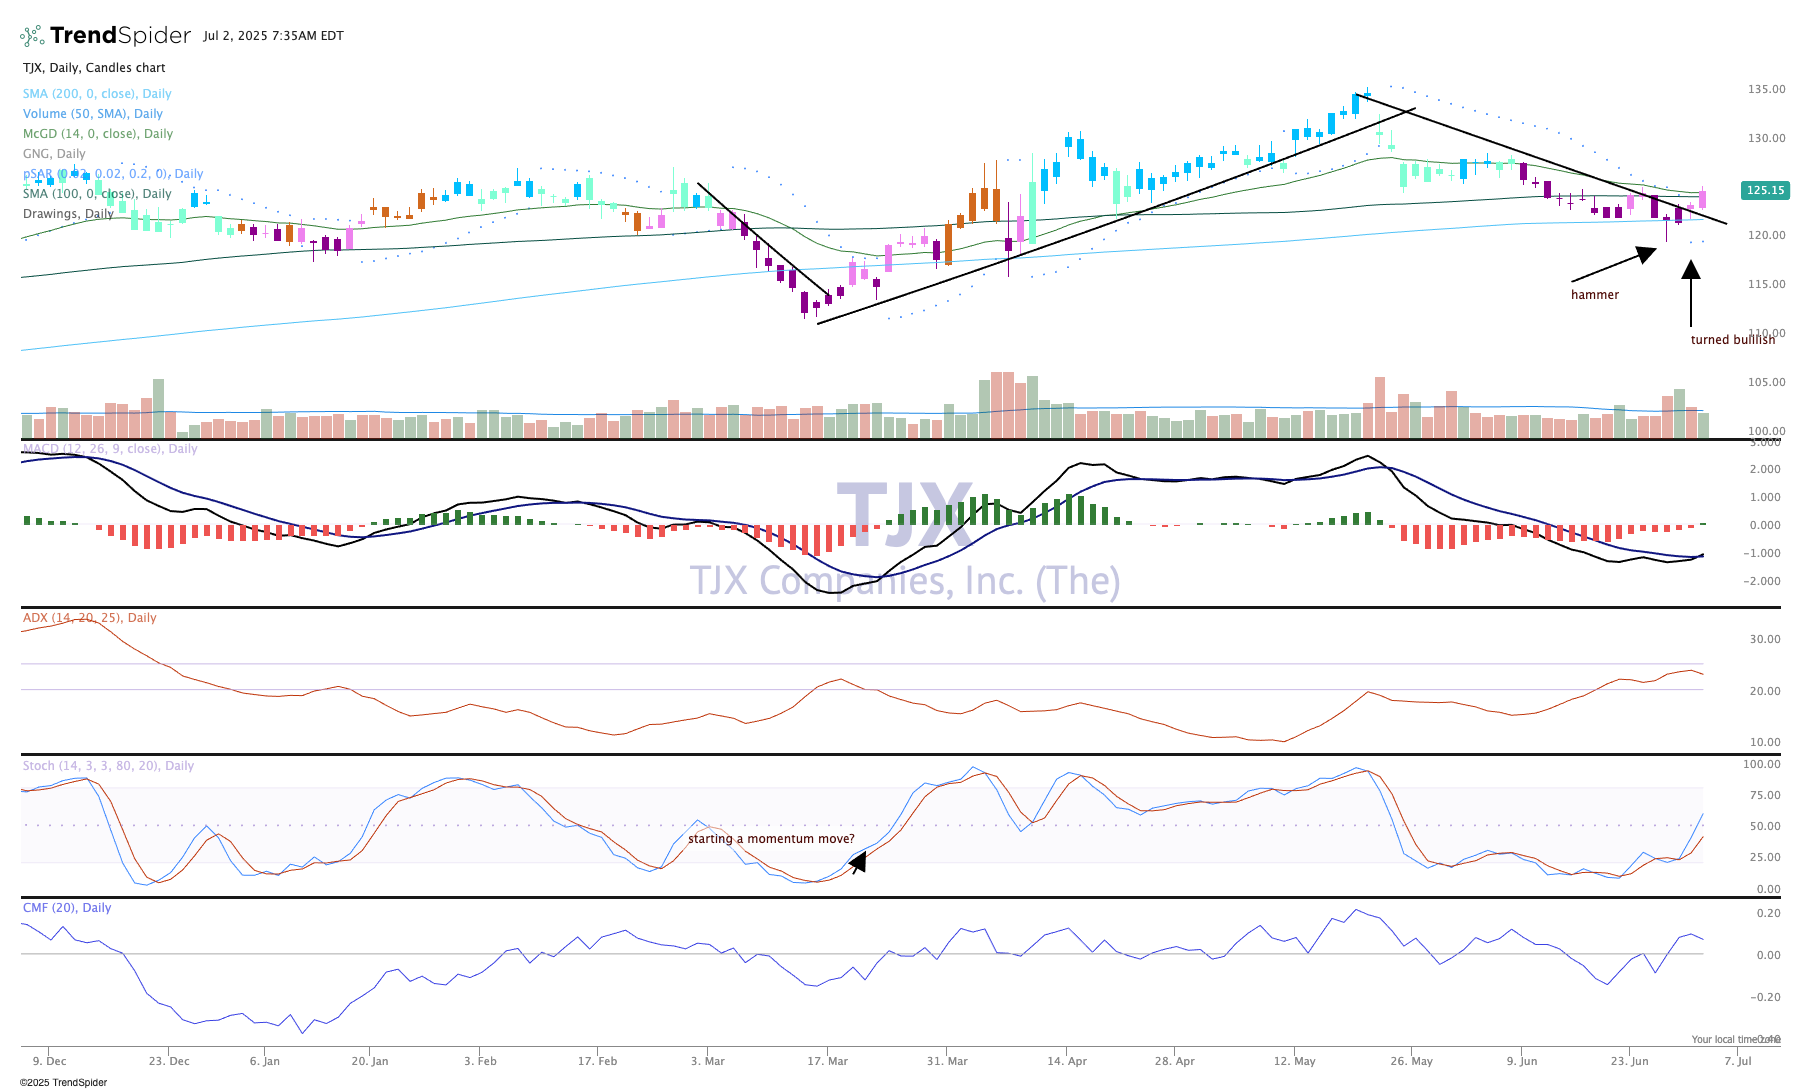
Other indicators are positive, with the MACD (moving average convergence divergence) turning up to a buy signal, stochastics strong and the Chaikin money flow bullish. Lastly, the parabolic SAR (stop and reverse system) just turned bullish, too.
At the time of publication, TheStreet Pro Portfolio was long TJX.
