Chart of the Day: Nvidia Indicators Begin to Brighten
While the price chart is bearish, some green shoots appear that could change the trend.
You've reached your free article limit
You've read 0 of 1 free Pro articles.
 Nvidia Chip
We trust the price chart to guide us in evaluating a stock. All things being equal, if there are more sellers than buyers then a stock will undoubtedly go lower. The opposite situation can happen too, but the move up is much more complex when you're combining the analysis of price with other indicators. Take Nvidia (NVDA) , which for a while was sporting a moderately strong price chart but the indicators were screaming "sell." That was a red flag warning, but not instantly. Eventually the price buckled; it broke $170 at one point last week. Nvidia tested the underside of the long channel we drew.
But that move down seemed to be a capitulatory moment. Nothing is more frustrating for a bull than to own a stock that should go up but is only going sideways or worse -- going lower. But the indicators tell us what is happening under the surface, and they are always turning -- oscillating.
Lately the supporting indicators are getting bullish, with a crossover in the moving average convergence divergence, simultaneously with stochastics (momentum) turning up. That is a powerful combo, but still the price chart is pink and reflects cautious bearishness.
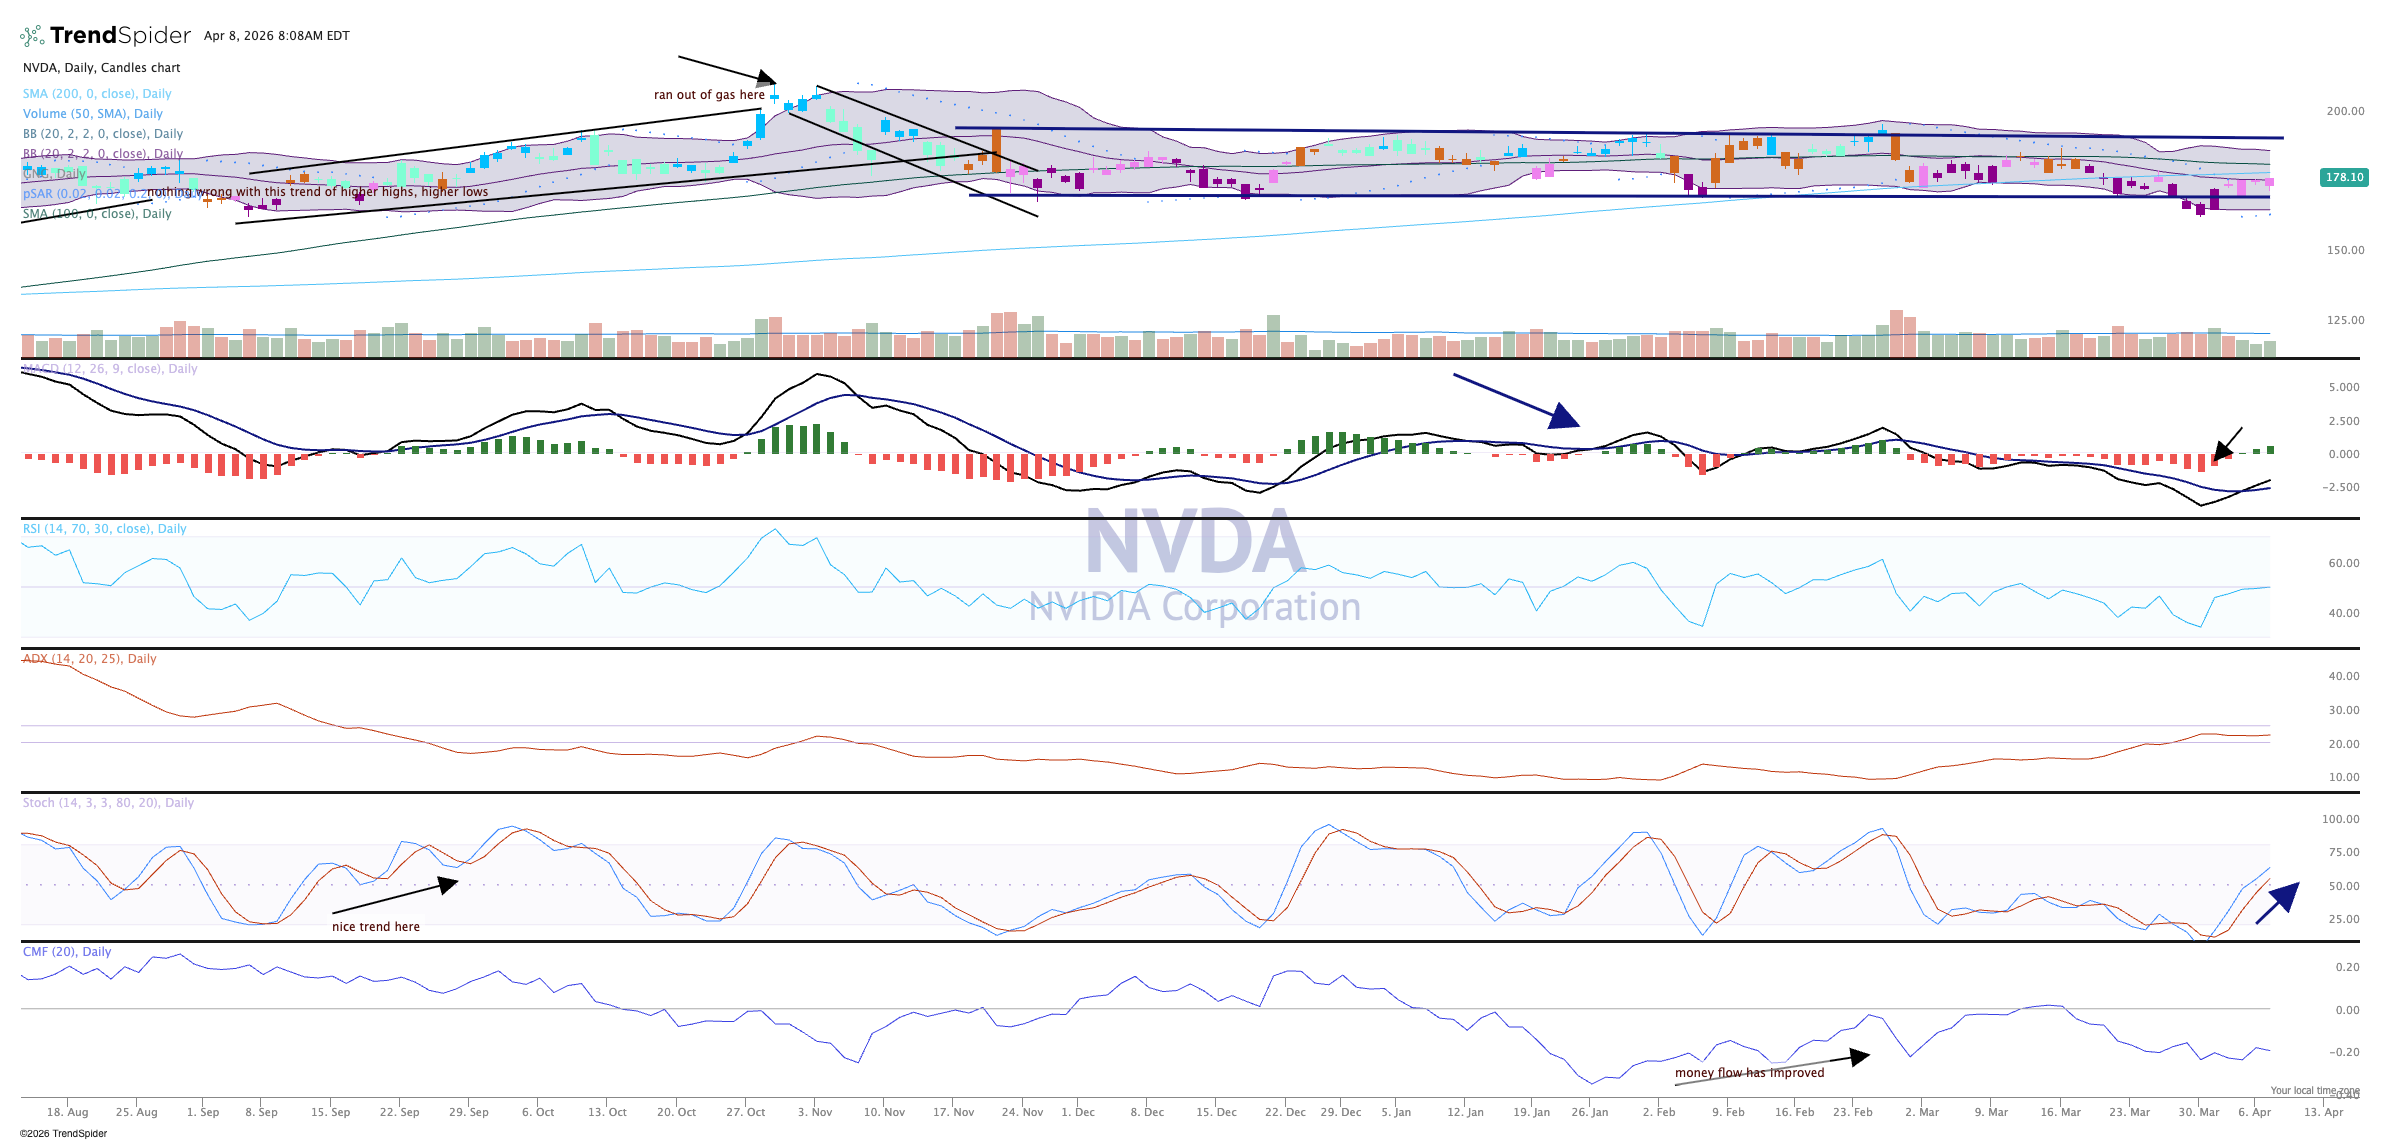
That might change soon, and a move above those "earnings high levels" in late February could bring more buying and test the $200 level one more time. If so, the chart will be bullish and it is game on.
We like Nvidia in TheStreetPro portfolio and rate it a one, buy at anytime.
The Pro Portfolio is long Nvidia.
