Chart of the Day: Nvidia Has a Dominant Pattern
The big semiconductor company achieves greatness, but we have our eye on one red flag.
You've reached your free article limit
You've read 0 of 1 free Pro articles.
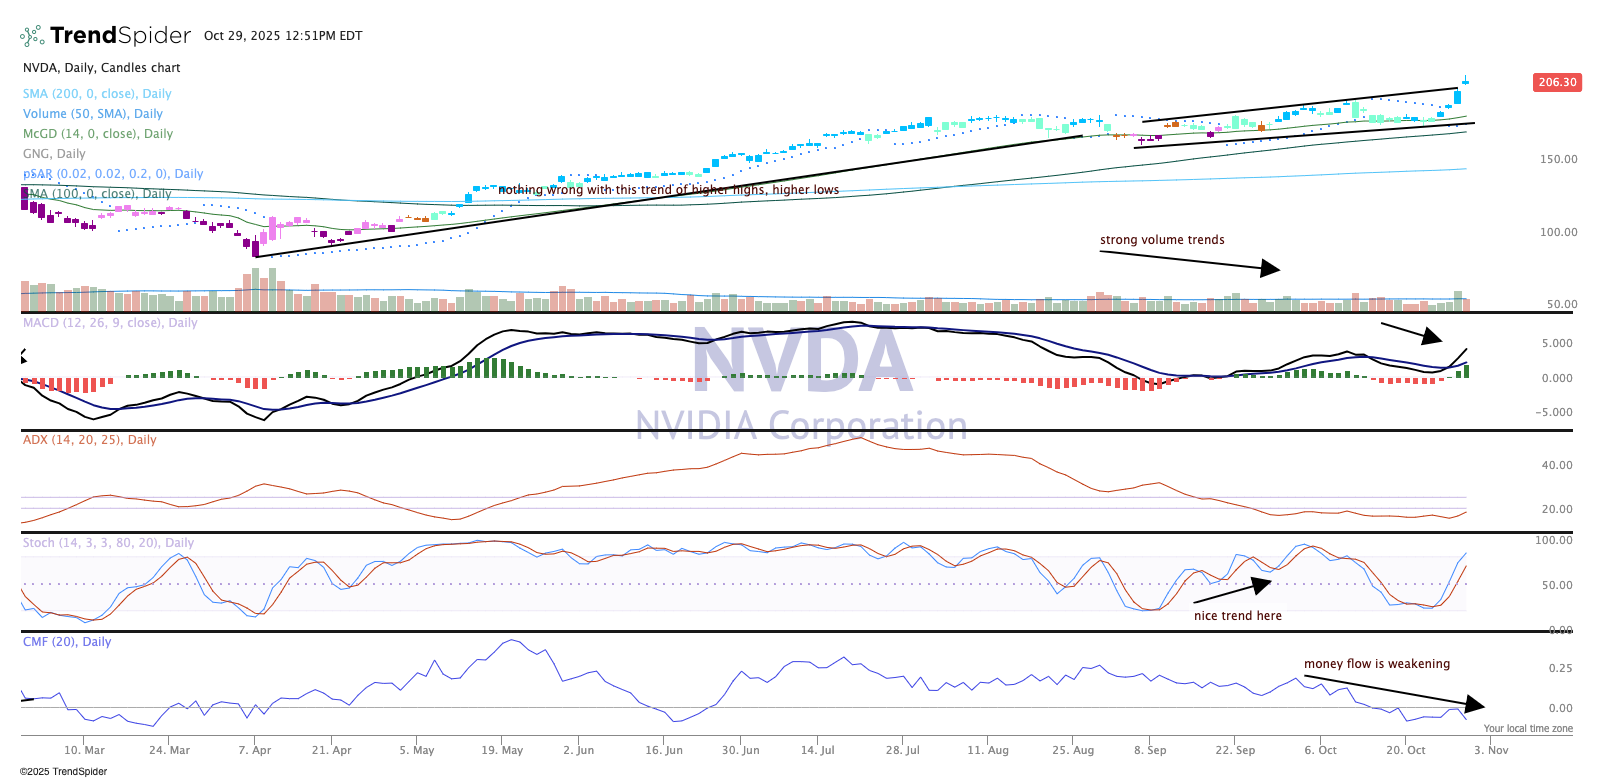
It is hard to argue with greatness. Nvidia stock (NVDA) has been on a massive roll this year, but has really ramped up the past few weeks. With a series of higher highs, higher lows the chart shows a dominant bullish pattern. Candles are blue as well, bullish on the GoNoGo composite of indicators. I also like where the moving average convergence divergence (MACD) is at, a bullish crossover confirmed.
But not all is joyful in Nvidia's, indicators. At the bottom is a red flag — the Chaikin money flow is weak and has now pushed into negative territory. Something to worry about? Maybe not right now as the chart does trump all other indicators, but certainly we have our eye on this.
A five trillion dollar company now, Nvidia is attracting lots of attention but probably for the wrong reasons. Savvy investors tend to "buy low and sell high," but those chasing after this behemoth right now may be sorely disappointed soon. We took some chips off the table today.
We like Nvidia in TheStreet Pro Portfolio and rate it a One, or "buy at anytime."
At the time of publication, TheStreet Pro Portfolio was long NVDA.
