Chart of the Day: Morgan's Movin' Up
The big diversified investment bank hovers near all-time highs and we like what we see in the chart.
You've reached your free article limit
You've read 0 of 1 free Pro articles.
The uptrend continues for Morgan Stanley MS. The chart is in great shape, a series of higher-highs/higher-lows, which is our textbook definition of an uptrend. Further, strong volume trends are present and they are certainly bullish. Looking at the top part of the chart here there are nothing but blue/teal candles.
That is a sign of bullishness according to the GoNoGo composite of indicators. In fact, we can trace this bullishness all the way to the left side of the chart. Since the April lows, MS is up a whopping 50%.
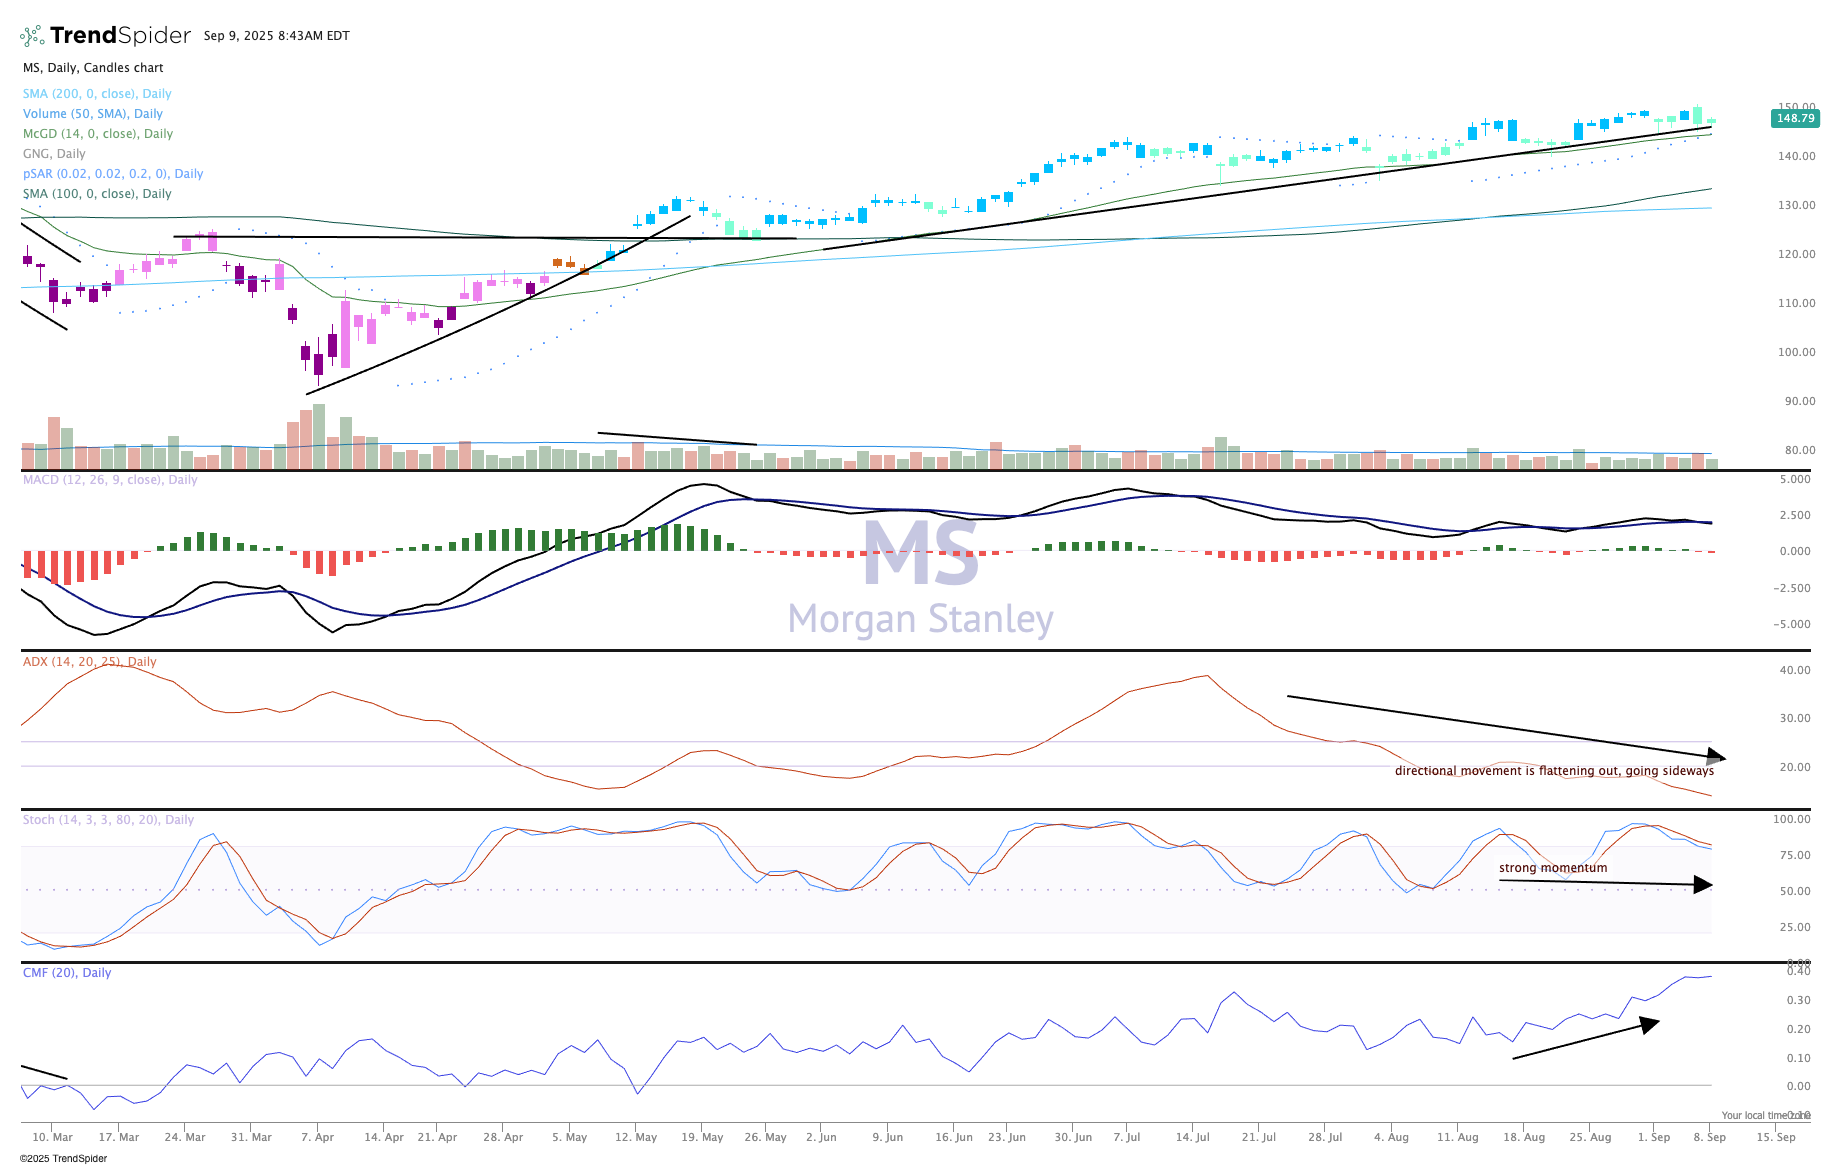
The indicators remain steady, with the parabolic SAR (stop and reverse) in the top pane supporting the price level. Check out the strength in chaikin money flow at the bottom, a clear sign that big institutional money has been pouring in to buy Morgan Stanley stock.
Stochastics (momentum) is healthy, and currently at a moment when we don't see too much news to rattle Morgan Stanley's cages.
We like Morgan Stanley in TheStreet Pro portfolio and rate it a two, or stockpile on pullbacks.
The Portfolio is long MS.
