Chart of the Day: Morgan Stanley Could Struggle if the Economy Falters
The big investment bank relies on a strong consumer and equally strong stock market to make advances. Here's what the technicals reveal.
You've reached your free article limit
You've read 0 of 1 free Pro articles.
 Chart of the Day: Mixed Readings on Morgan Stanley
A failure to move past the $190 level in January, which was a new high for Morgan Stanley (MS) was the first sign that the stock was looking to correct. Since then, MS has fallen about 16%, about average for a corrective period. But is the correction over?
One might see the test of the 200-day moving average as a place where the stock could bounce. That seems quite logical. However, if we consider the indicators and the price action we might pause on that thought.
The candles have been pink/purple for about six weeks; that is bearish on the GoNoGo composite of indicators. MACD (moving average convergence divergence) has been on a sell signal since mid-January, before the price action really turned bearish.
Money flow remains buoyant, but the momentum has been down for a bit. The ADX is strong too, telling us the trend is very solid (that trend is down).
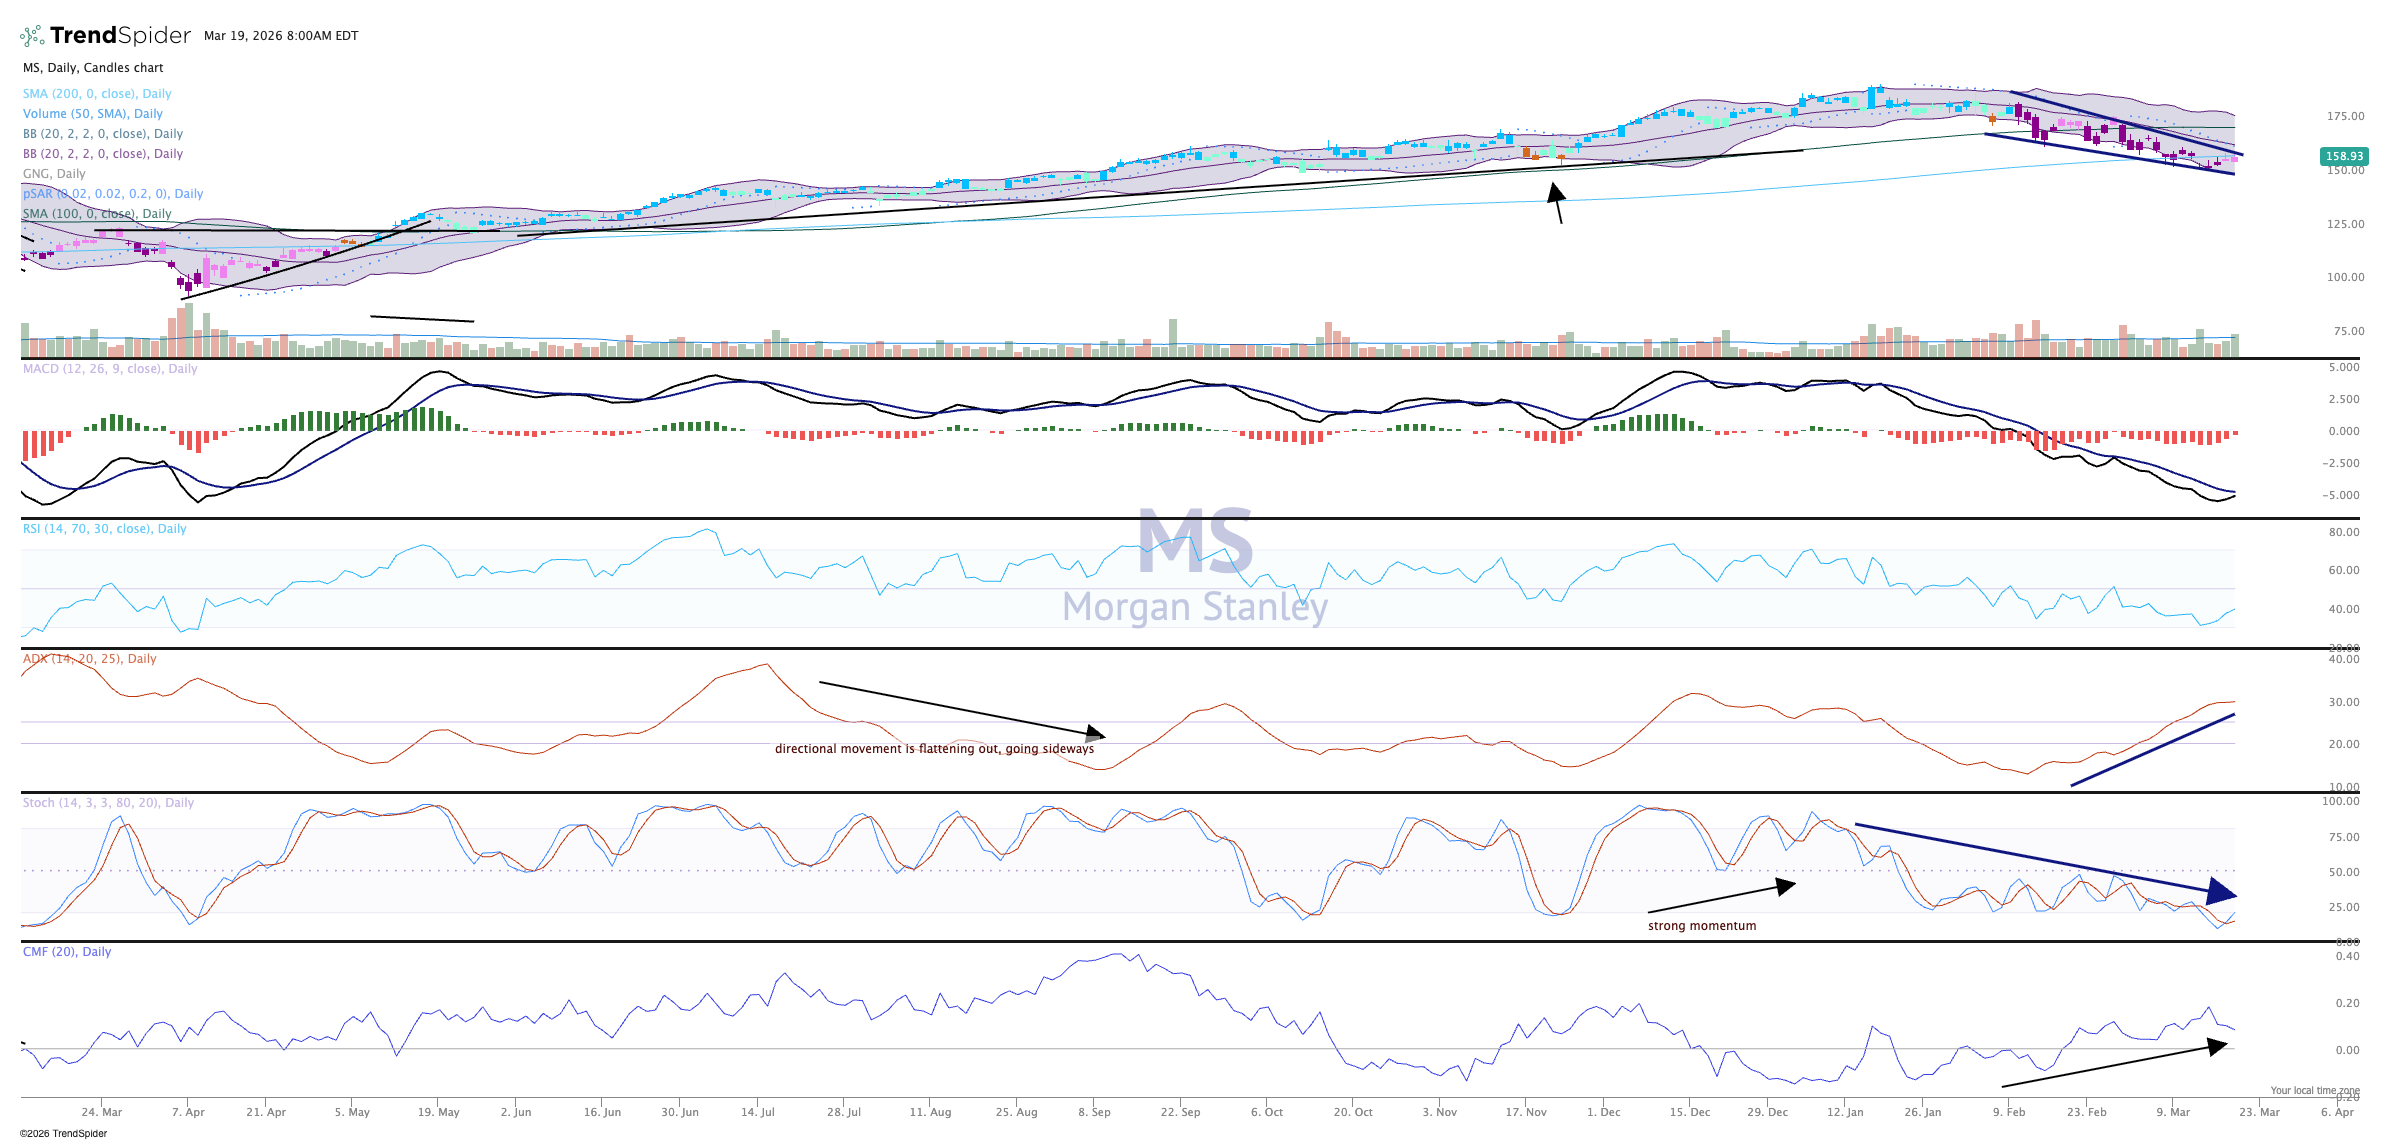
Volume trends have picked up and they are bearish as well. There's just nothing good right now on the chart. At best, we would like to see the stock move sideways for a few weeks, frustrate both bulls and bears, then wait to see how it responds to earnings in mid-April.
We like Morgan Stanley in TheStreet Pro Portfolio and rate it a One, or "buy at anytime."
Related: Bitcoin Traders See a Green Light at $75,000
At the time of publication, TheStreet Pro Portfolio was long MS.
